Check your test runs
The Executions tab in the Elastic Execution Grid user interface shows the state of your tests. This gives you a good overview of the state of your system under test. Did it perform as expected? Or are there areas you may need to pay attention to and re-test?
The tab displays the following information:
The state of your tests. Did your Flows A Flow determines the sequence of your tests. It consists of other Flows, which in turn consist of Units. pass or fail?
The progress of your tests. How far along are your tests?
Detailed information on individual Flows, including logs and recordings.
Access the Executions tab
To access the Executions tab, click on ![]() Executions in the menu bar on the left.
Executions in the menu bar on the left.
You can also check your
Navigate the Executions tab
You can ![]() search for a particular Flow in the table header, or you can sort and filter results.
search for a particular Flow in the table header, or you can sort and filter results.
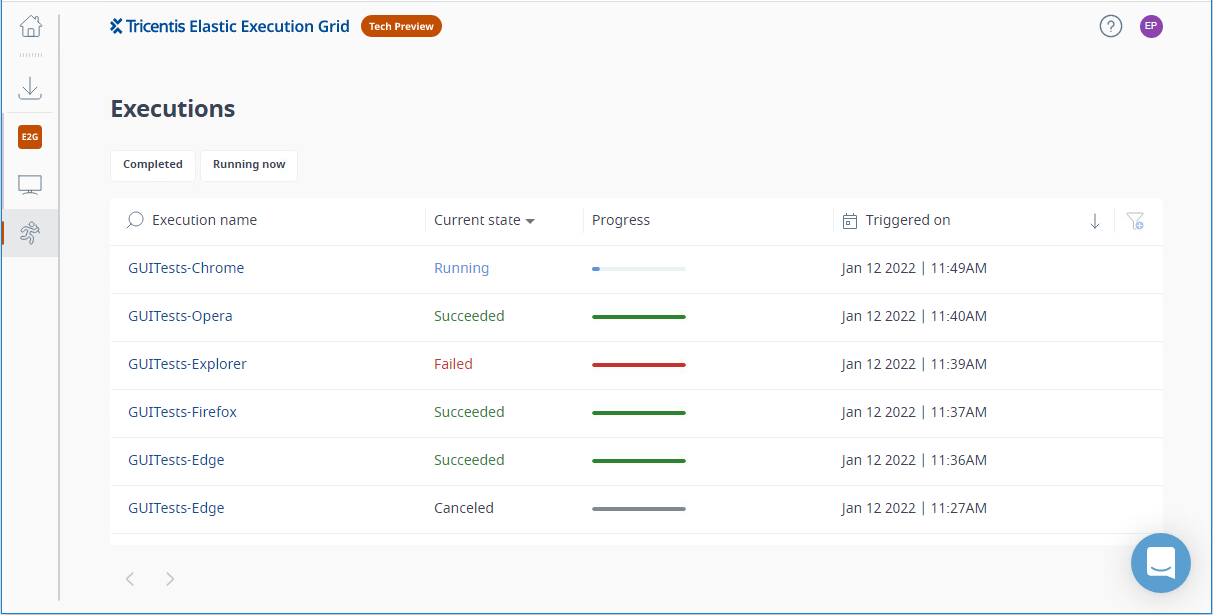
Executions view of Elastic Execution Grid
Check the state
The Current state column displays the state of a Flow:
State | Description |
|---|---|
Pending | Waiting for execution. |
Running | Execution is in progress. |
Canceling | Execution is being canceled. This status shows from the moment that you cancel a Flow until all Units The smallest unit of testing in your Flow. The concept is the equivalent of a TestCase in Tricentis Tosca. that are being executed at the time of canceling are finished. |
Canceled | Execution was canceled or has timed out. Timeouts happen for the following reasons:
|
Succeeded | The tests passed. |
Failed | The tests failed. If one Unit fails, the entire Flow reports as Failed. |
Check the progress
The Progress column displays the progress of a Flow:
Progress | Description |
|---|---|
Blue bar | The execution is pending or running. |
Green bar | The execution has succeeded. |
Red bar | The execution has failed. |
Gray bar | The execution has been canceled. |
To get detailed information, hover over the progress bar. The subsequent pop-up lists all Units and their current results.
Check the execution date
The Triggered on column shows when an execution was triggered. The time is the local time of the machine with which you access Elastic Execution Grid.
Sort and filter results
You don't have to wade through the whole list of
Sort in
 ascending or
  descending order.
Filter by selecting options from the
 drop-down menu.
 You can also
 filter results by a specific date or time frame when tests were triggered.
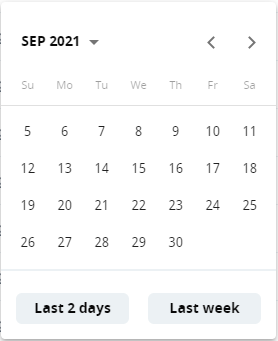
Filter results by a specific date or time frame
Forward filter results
You can forward the results of your filters to other users, for instance for reporting purposes.
When you apply a filter, the URL changes. To forward results, copy and forward the filter URL.
Create custom filters
If you find yourself using the same filters over and over, you can save them as permanent custom filters. Then you don't have to filter manually every time.
You can create up to 3 additional custom filters.
To create a custom filter, follow the steps below:
Filter your data as needed.
Applying filters activates the
 Create custom filter button. Click the button to create a new custom filter.
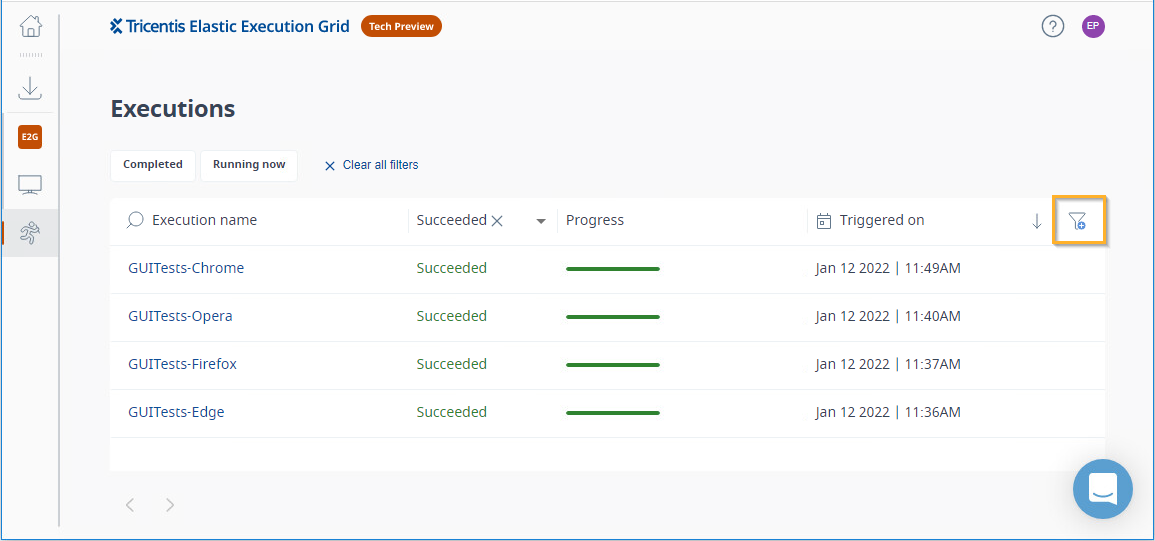
Create a new custom filter
This adds a new filter field to the top of the table. Name your custom filter.
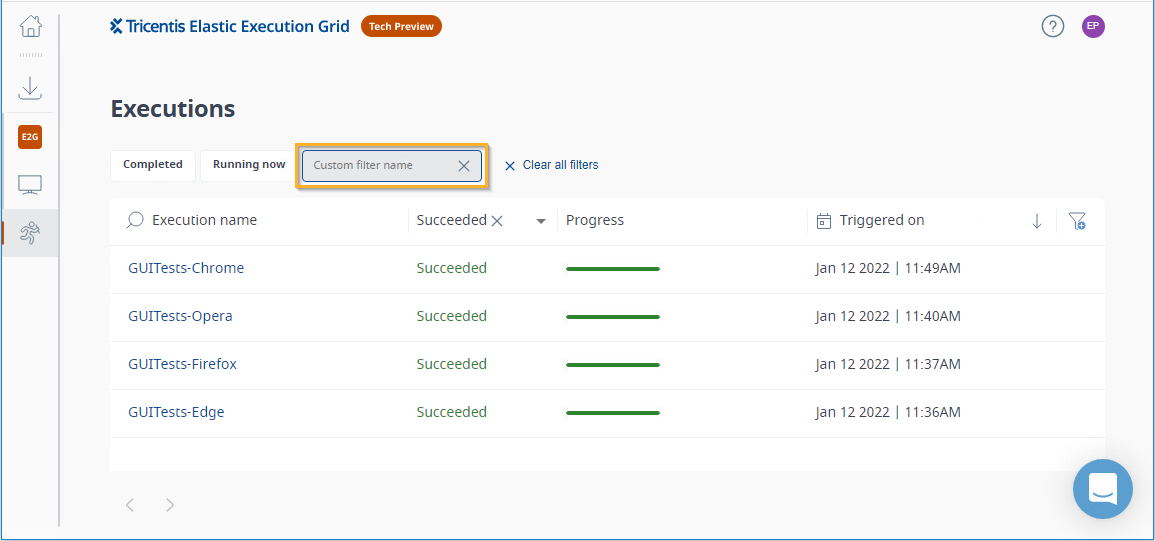
Name your custom filter
To delete a custom filter, click the x in the custom filter field.
Clear filters
To remove any filters that you have currently applied, click Clear all filters. This clears the current filters; it doesn't delete your custom filters.
View detailed results
The detail view of a Flow gives you a step-by-step account of what was tested, how Elastic Execution Grid ran these tests, and how your system under test reacted. This allows you to detect and fix vulnerabilities early on.
To open the detail view, click on the name of the Flow in the Executions tab.
The detail view consists of the following elements:
A header bar with summary information on the latest/current run. Additionally, you can cancel pending or running executions by clicking on
 Stop.
Stop. A table with detailed information on the content of the Flow.
For Tricentis Tosca tests, the degree of detail depends on the execution type you chose when you triggered your tests in Tricentis Tosca. If you chose SequentialMultipleMachines or Parallel, you get results on Unit (TestCase) level.
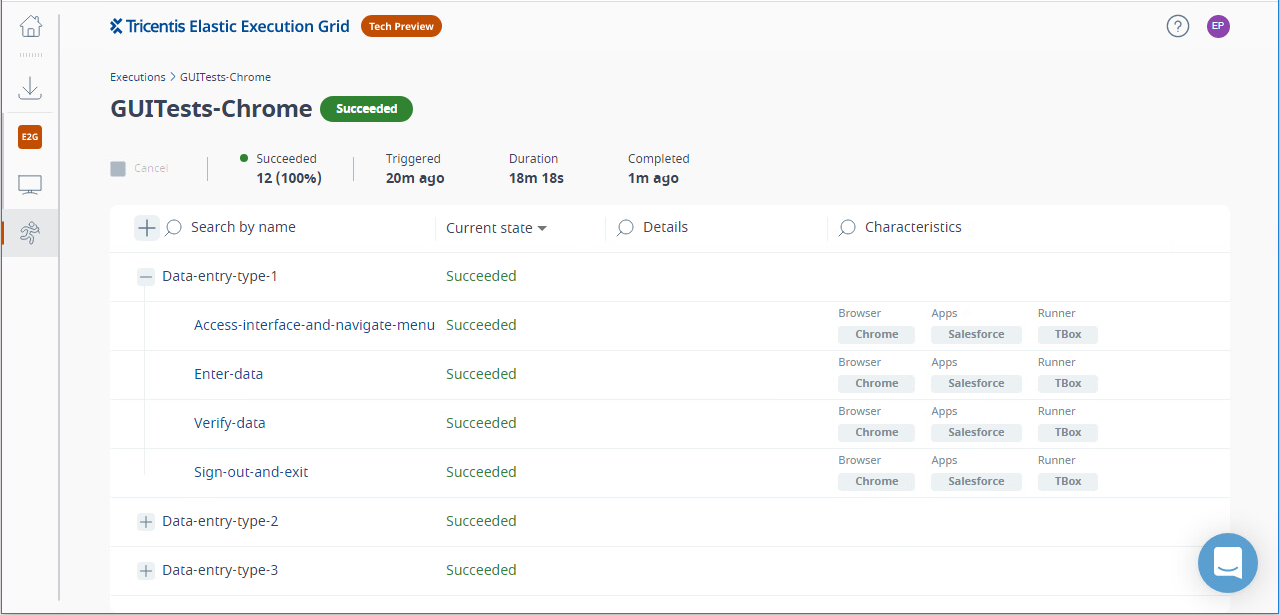
Detail view of a Flow, down to Unit level
Additionally, you can drill down even further. Click on an object in the table to view the following:
A detailed execution log.
A recording of the execution. Elastic Execution Grid only creates recordings if your admin has configured the executing Agent for recordings.
Attachments, if your test framework generates attachments during execution.
You can search and filter for Units and download the log, recording, and/or attachments.