Contents Display
The Contents tab is available for table contents results accessed from a Hierarchy dataset or report, or compared by the Quick Compare Wizard. It displays a grid control with columns showing the fields from the compared table, and rows showing the table values. The first column in the display indicates the comparison status for each row, and the System column indicates the RFC Destination of each of the compared systems. Key fields are shaded in green.
If the Contents tab contains comparison results, the grid control uses the following display conventions:
- If a row is shaded in cyan,
the row data exists in the first compared system only. Its RFC Destination
is shown in the System column, and the comparison status column is marked
with
 .
. - If a row is shaded in pink,
the row data exists in the second compared system only. Its RFC Destination
is shown in the System column, and the comparison status column is marked
with
 .
. - If a row is unshaded, the row
data is the same in each of the compared systems. The System column is
left blank, and the comparison status column is marked with
 .
. - If the comparison status column
is marked with
 , the row data is different in each of the compared systems.
Field values are displayed from each of the compared systems. Values that
are different are shown in red with a yellow background, values that are
the same are shown in black with an unshaded background.
, the row data is different in each of the compared systems.
Field values are displayed from each of the compared systems. Values that
are different are shown in red with a yellow background, values that are
the same are shown in black with an unshaded background.
Click a link in the comparison status column to open the Row Details screen, which displays field values and descriptions for the selected row.
The columns in the grid control may be resized by dragging the resize handles in the column headings. With the exception of the first column, a column may be expanded or contracted by double-clicking the handle on its right.
A range of cells may be selected in the grid control by using Left Click+Drag in the column headings, row headings or table body. Alternatively, use Shift+Arrow Keys to select cells using the keyboard. To select the entire table, choose ‘Select All’ from the grid control’s context menu. To clear a selection, choose ‘Clear All’ from the context menu, or click the cell labeled # in the top left-hand corner of the grid control. The following keyboard shortcuts may also be used
- Page Up scrolls the display up by one page.
- Page Down scrolls the display down by one page.
- Home selects the first cell in the current row.
- End selects the last cell in the current row.
- Ctrl+Home selects the first cell in the current column.
- Ctrl+End selects the first cell in the current column.
To export the selection to an Excel spreadsheet, choose ‘Copy Selection to Excel’ from the grid control’s context menu. To copy the selection to the Windows Clipboard, choose ‘Copy’ from the context menu, or press Ctrl+C. If a column is selected, all the column rows are copied, not just the rows that have been loaded into the grid control.
 Options
Click the ‘Options’ icon to show or hide the Options dialog:
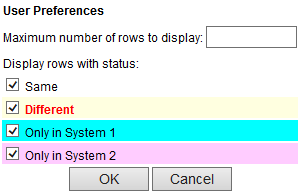
Enter a maximum number of table rows to display in the ‘Maximum number of rows to display:’ field. This value applies to all tables viewed by the current user, and is also stored in the ‘Maximum number of rows/objects to display:’ User Preferences field.
If the table shows comparison results, select the appropriate check boxes in the ‘Display rows with status:’ section to display only those table rows with the selected comparison statuses. Each LiveCompare user may have their own settings, but the settings apply to all table comparison views.
Click ‘OK’ to save your changes.
 Export to
Excel
Export to
Excel
For Hierarchy datasets, click the ‘Export to Excel’ icon to export the Table’s contents to Microsoft Excel.