Execute Graphviz Action Examples
The following examples illustrate the use of the Execute Graphviz action.
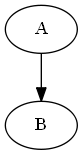
Creating a Simple Directed Graph
A simple directed graph may be generated using the Execute Graphviz action as follows. Create a new workflow and create nodes for the Command, Source and Result properties only. Set the Command parameter to ‘Dot’, and the Source parameter to the following table:
| SOURCE | TARGET | SOURCE_ATTRIBUTES | TARGET_ATTRIBUTES | EDGE_ATTRIBUTES |
|---|---|---|---|---|
| A | B |
Run the workflow, and then examine the Result dataset.
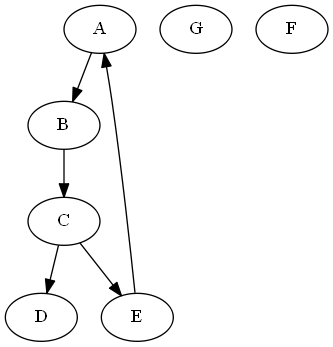
Adding Additional Nodes
Additional nodes may be added to the graph by specifying new SOURCE and TARGET entries in separate table rows. A source node may link to zero or more target node, and a target node may link to zero or more source nodes. Modify the workflow’s Source table so it looks like this:
| SOURCE | TARGET | SOURCE_ATTRIBUTES | TARGET_ATTRIBUTES | EDGE_ATTRIBUTES |
|---|---|---|---|---|
| A | B | |||
| B | C | |||
| C | D | |||
| C | E | |||
| E | A | |||
| F | ||||
| G |
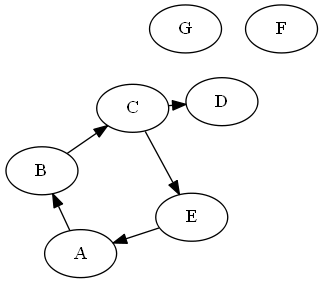
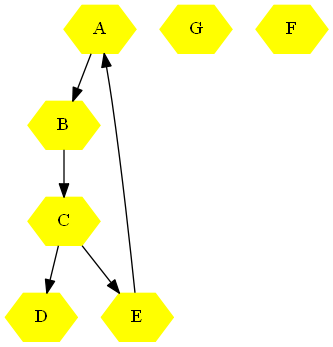
Run the workflow. The graph stored in the Result dataset looks like this:
Command Values
The Execute Graphviz action’s Command parameter specifies the layout engine that is used to draw the graph. Use the Command parameter’s drop-down list to test the other layout engines.
circo
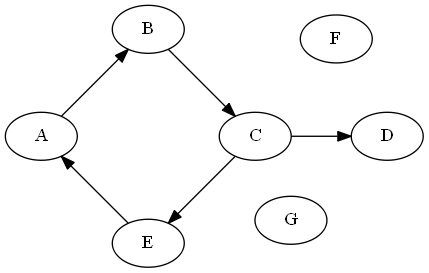
fdp
neato
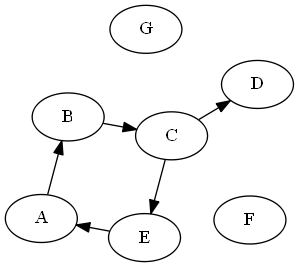
sfdp
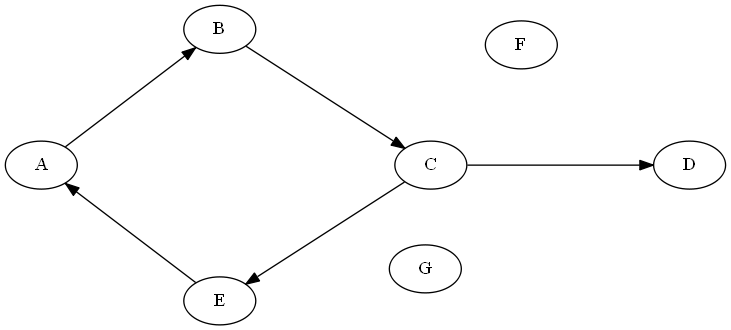
twopi
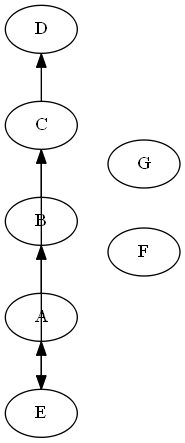
Reset the command parameter to ‘dot’.
Node Attributes
The Node Attributes String List parameter specifies default attributes that apply to each node in the graph. These attributes may be overwritten for individual nodes by setting source attribute and target attribute values in the Source table. Each entry in the Node Attributes string list should have the format <Attribute>=<Value>.
Add a Node Attributes node to the workflow and set the parameter as follows. Note that each entry should be stored as a separate string element.
shape=polygon
sides=6
color=yellow
style=filled
Run the workflow. The graph referenced by the Result dataset looks like this:
Setting Attributes for Individual Nodes
The Execute Graphviz action’s Source table includes columns named SOURCE_ATTRIBUTES and TARGET_ATTRIBUTES. These columns may be used to overwrite the Node Attributes for individual graph nodes. The columns should be set to a comma-separated list of <Attribute>=<Value> entries, for example:
sides=3, color=green
-
If a node is listed in the SOURCE column only, you should set the node’s source attributes in the row where the node appears in the SOURCE column.
-
If a node is listed in the TARGET column only, you should set the node’s target attributes in the row where the node appears in the TARGET column.
-
If a node is listed in both the SOURCE and TARGET columns, you should set the node’s source attributes in rows where the node appears in the SOURCE column.
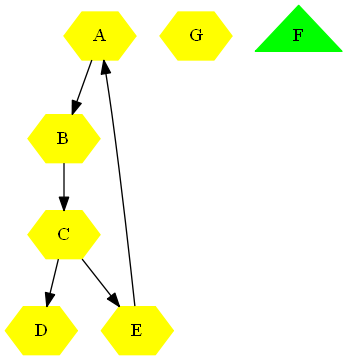
In the example workflow, change node F to a green triangle by modifying the Source table as follows.
| SOURCE | TARGET | SOURCE_ATTRIBUTES | TARGET_ATTRIBUTES | EDGE_ATTRIBUTES |
|---|---|---|---|---|
| A | B | |||
| B | C | |||
| C | D | |||
| C | E | |||
| E | A | |||
| F | sides=3, color=green | |||
| G |
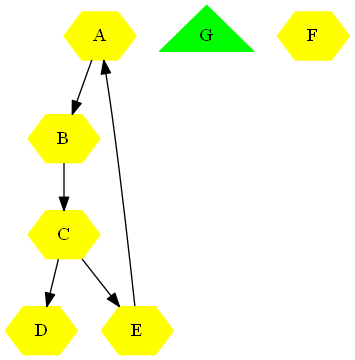
Change node G to a green triangle by modifying the Source table as follows.
| SOURCE | TARGET | SOURCE_ATTRIBUTES | TARGET_ATTRIBUTES | EDGE_ATTRIBUTES |
|---|---|---|---|---|
| A | B | |||
| B | C | |||
| C | D | |||
| C | E | |||
| E | A | |||
| F | ||||
| G | sides=3, color=green |
Change node B to a green triangle by modifying the Source table as follows.
| SOURCE | TARGET | SOURCE_ATTRIBUTES | TARGET_ATTRIBUTES | EDGE_ATTRIBUTES |
|---|---|---|---|---|
| A | B | sides=3, color=green | ||
| B | C | sides=3, color=green | ||
| C | D | |||
| C | E | |||
| E | A | |||
| F | ||||
| G |
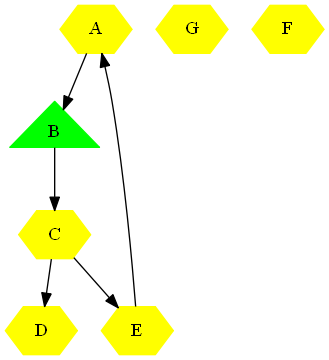
In the table editor, be sure to uncheck the ‘Force Upper Case’ check box when editing source or target attributes.
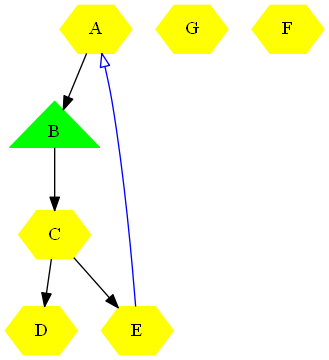
Edge Attributes
The Execute Graphviz action’s Source table includes a column named EDGE_ATTRIBUTES, which may be used to specify the attributes for the links between nodes. To change the link between E and A to an unfilled blue arrow, modify the Source table as follows. In the table editor, be sure to uncheck the ‘Force Upper Case’ check box when editing source or target attributes.
| SOURCE | TARGET | SOURCE_ATTRIBUTES | TARGET_ATTRIBUTES | EDGE_ATTRIBUTES |
|---|---|---|---|---|
| A | B | sides=3, color=green | ||
| B | C | sides=3, color=green | ||
| C | D | |||
| C | E | |||
| E | A | color=blue, arrowhead=empty | ||
| F | ||||
| G |
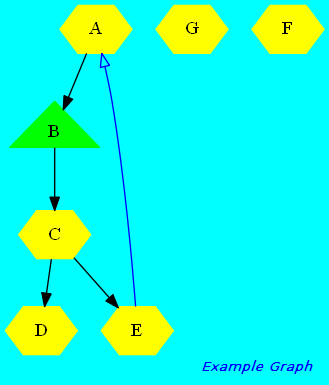
Graph Attributes
The Graph Attributes String List parameter specifies attributes that apply to the graph. Each entry in the string list has the format <Attribute>=<Value>.
Add a Graph Attributes node to the workflow and set the parameter as follows. Note that each entry should be a separate string element.
bgcolor=cyan
label=“Example Graph”
labeljust=right
fontname="helvetica bold italic"
fontcolor=blue
fontsize=10
Run the workflow. The graph referenced by the Result dataset looks like this: