Using Drill Down Pages
In qTest Insights. you are able to drill-down from data in the below locations:
-
Analysis Grid of Explore Data section
-
Data table of Analysis Reports (Quality, Coverage, Velocity)
-
Any chart (clicking on a piece of pie of pie chart, or a point in line chart, an area in heat map, etc.)
This article will describe functionalities you are able to do on the drill down pages.
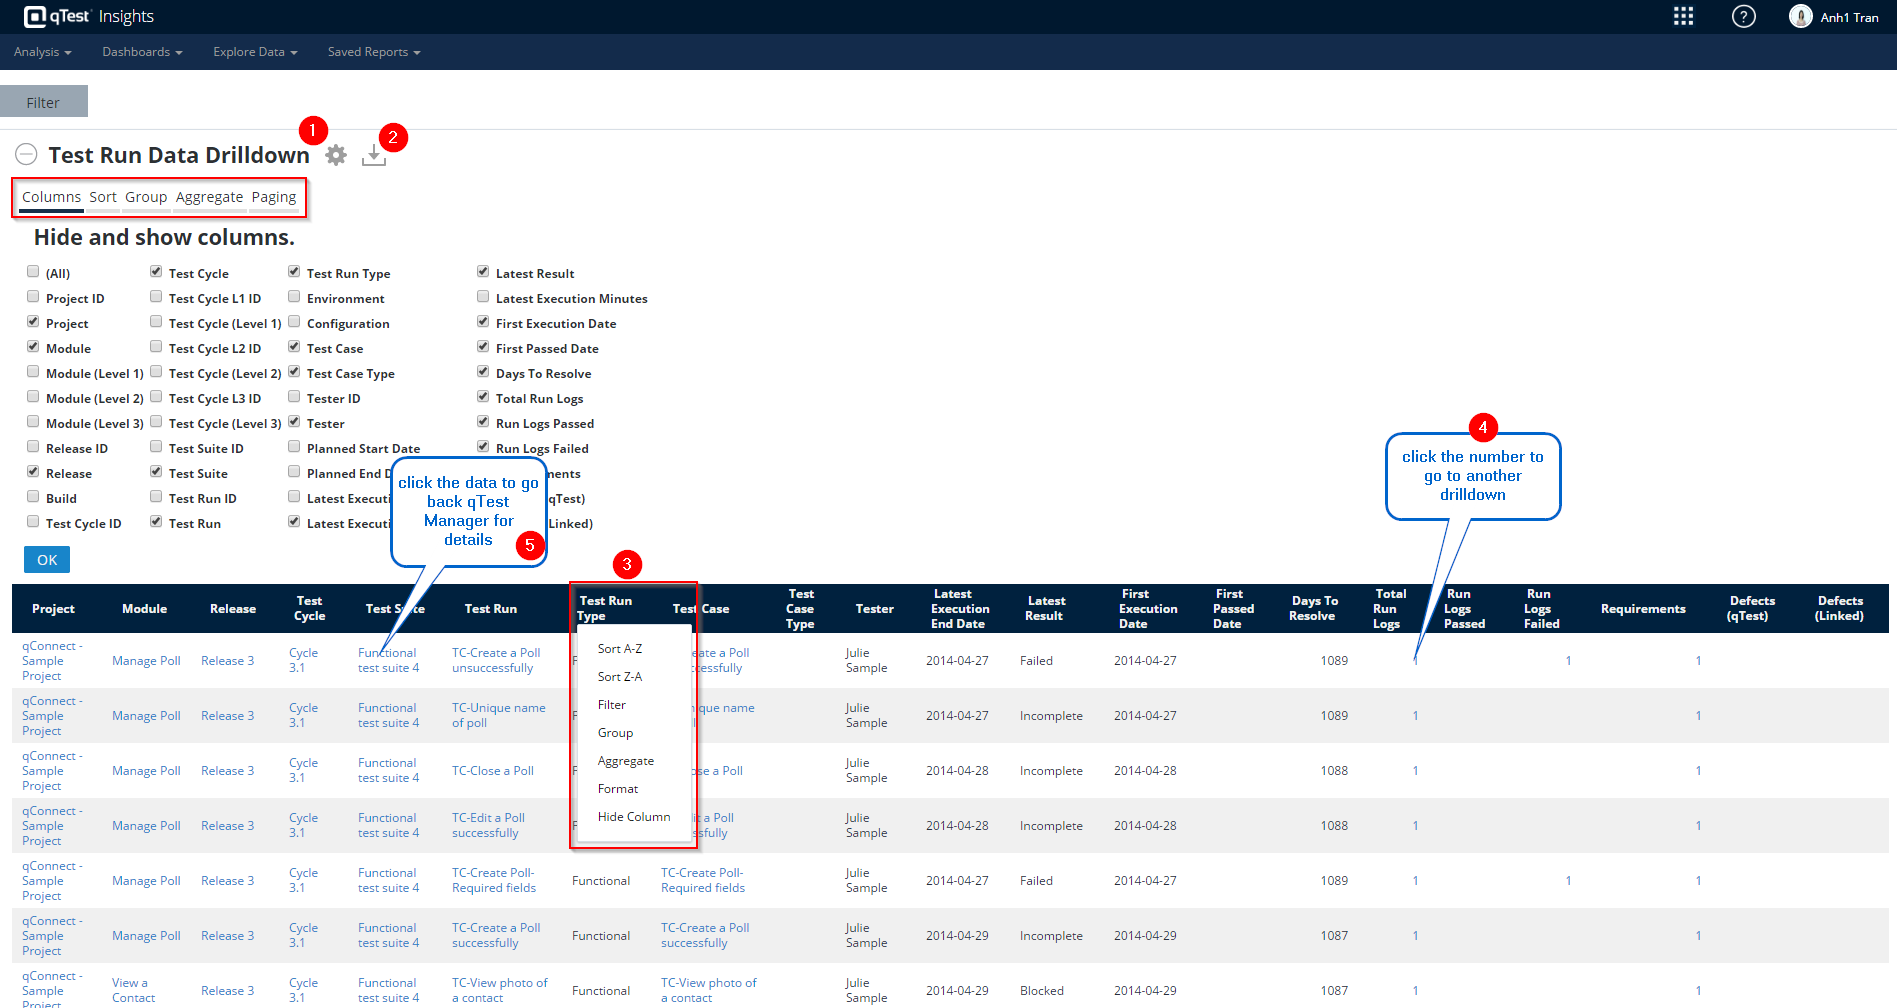
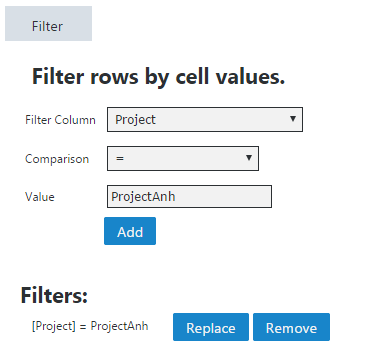
Filter Options
Click Filter button to open the feature. This allows you to filter data to be displated in the data analysis grid.
Grid Settings
Export: Click the icon  to Export data to pdf, CSV, Excel.
Click the gear icon on  the data grid section.
-
Hide/show column on the grid: select columns you want to be displayed in the data grid
-
Sort: select “Sort” to sort any column of the data grid by ascending/ descending.
-
Group: select “Group”, you are able to organize rows in the data grid with grouping and sub-grouping.
-
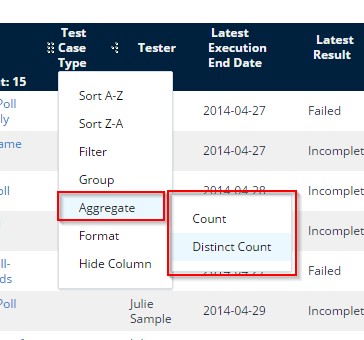
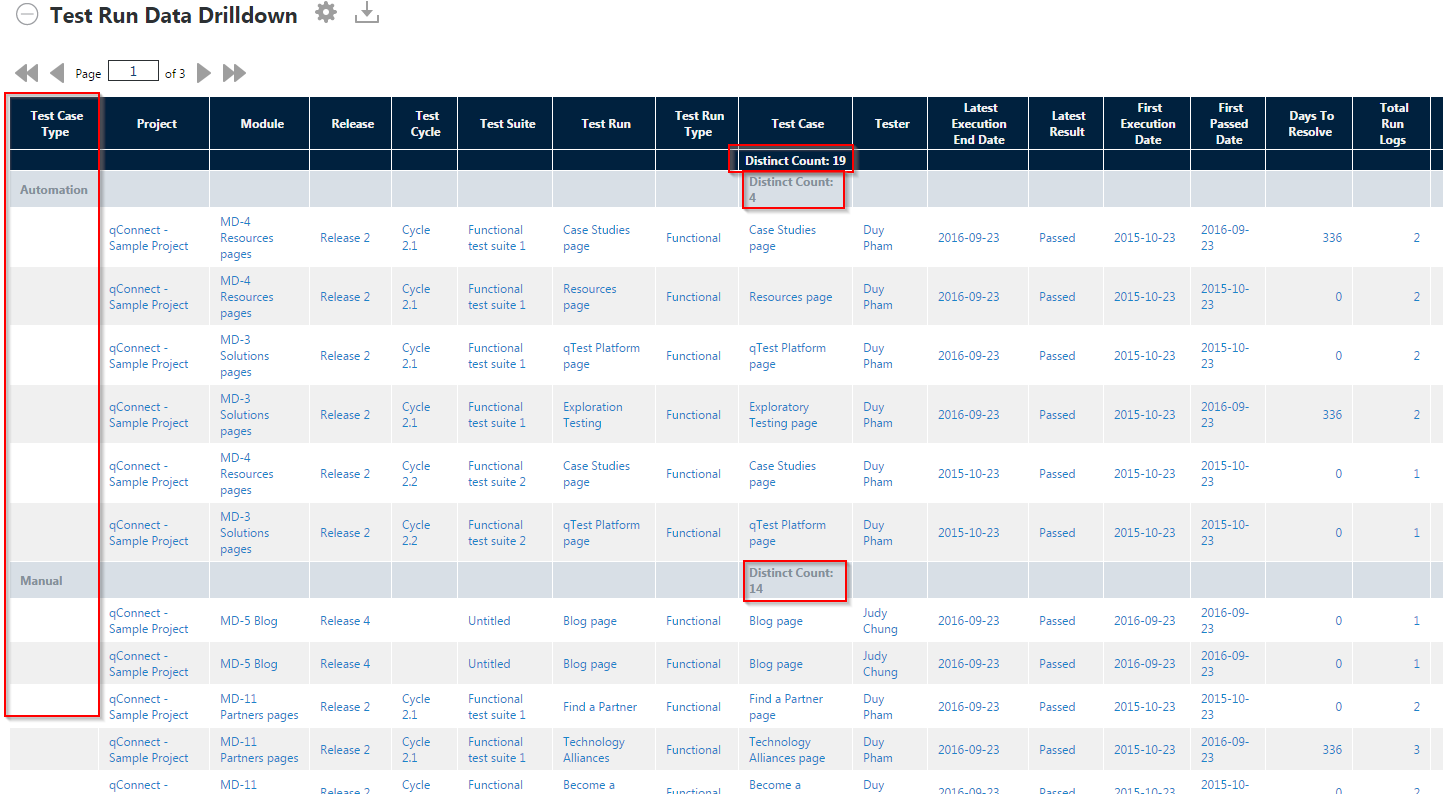
Aggregate: select "Aggregate" for the ability to calculate totals, averages, and such for the top and grouped levels.
The image below is an example of grouping by Test Case Type column and Aggregate "Distinct Count" on Test Case column.
Interacting with Columns
-
Click on the column name, you will have ability to sort, filter, group, aggregate, add to chart, etc.
-
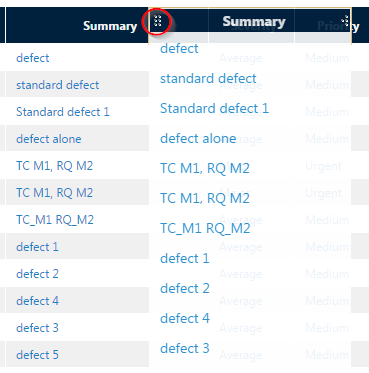
Drag & drop column around the grid: hold the icon
 (left side of column header) to drag and drop your column to another position.
 -
Resize column width: hold the icon
 (right side of column header) and move the mouse to resize the column.
.
Drill Down Further
Click linked data on the grid to drill down to other data set.
Link qTest Manager
Click through to qTest Manager for object names and IDs shown in the report. You are able to click to go back to qTest Manager tab and view details on those objects.