Legacy Cross Project Reporting
All qTest cross-project reporting should be done through qTest Insights or Tricentis Analytics,our self-service business intelligence tools for test analytics.
This article refers to our legacy reporting.
Accessing Legacy Cross-Project Reporting
To access Legacy Cross-Project Reporting, follow these steps:
-
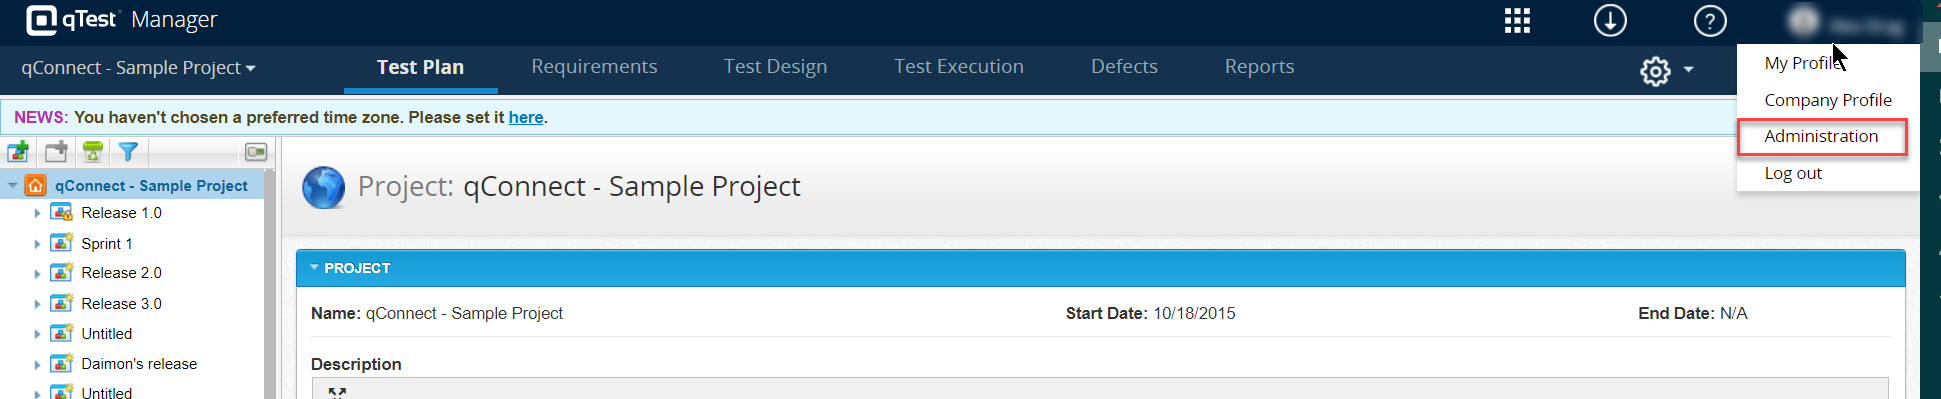
In your username drop-down menu, selectAdministration.
-
The "Site Administration" page displays. Select theReportstab.
-
The two reports are listed in the left menu.
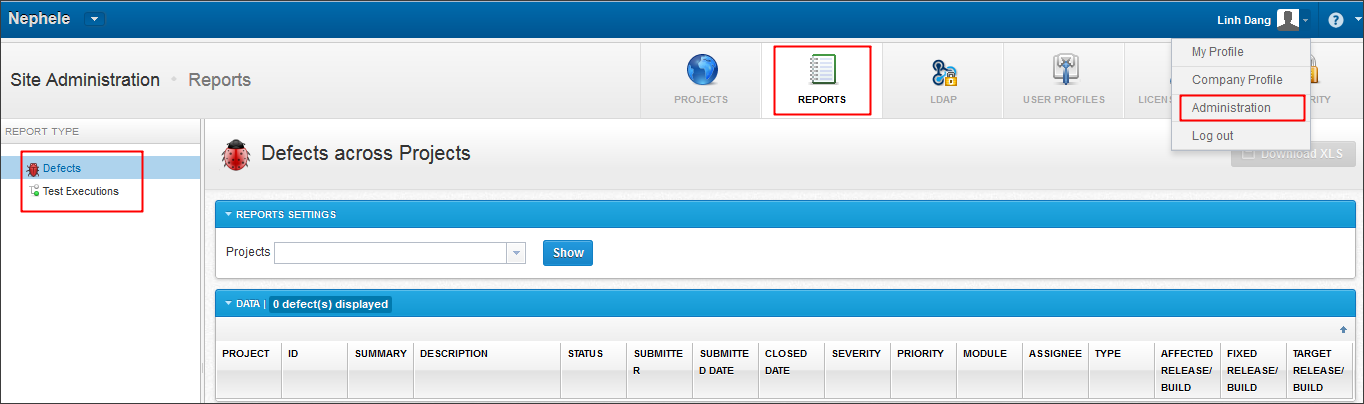
Defects
This report provides you the detailed data of all Defects across multiple projects at the report run time. Follow these steps to view the report:
-
SelectDefectsfrom the menu on theleft-handside.
-
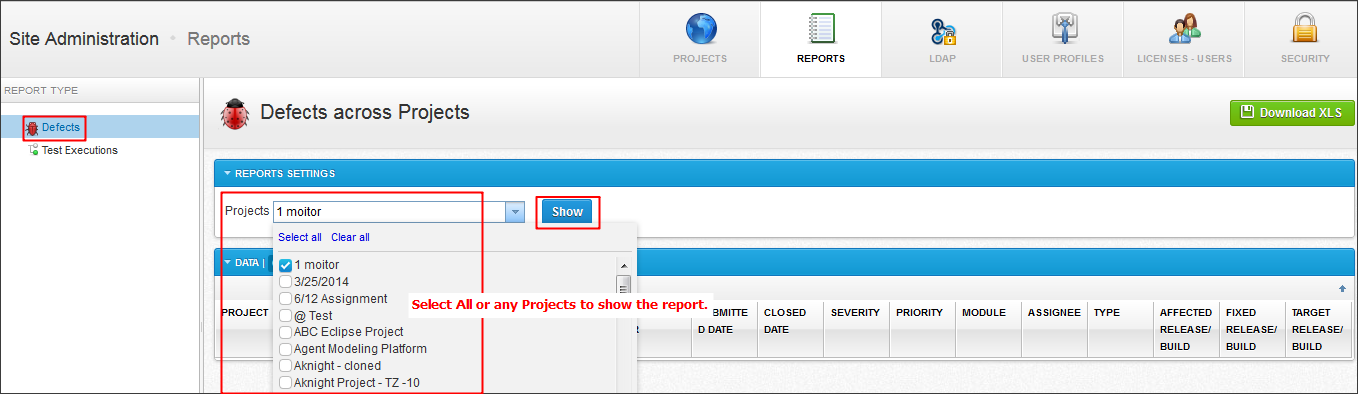
By default, the report is loaded with no data. Users must select the project to show the report.
-
After selecting one or more projects from the drop-down list, selectShow to view the data grid.
-
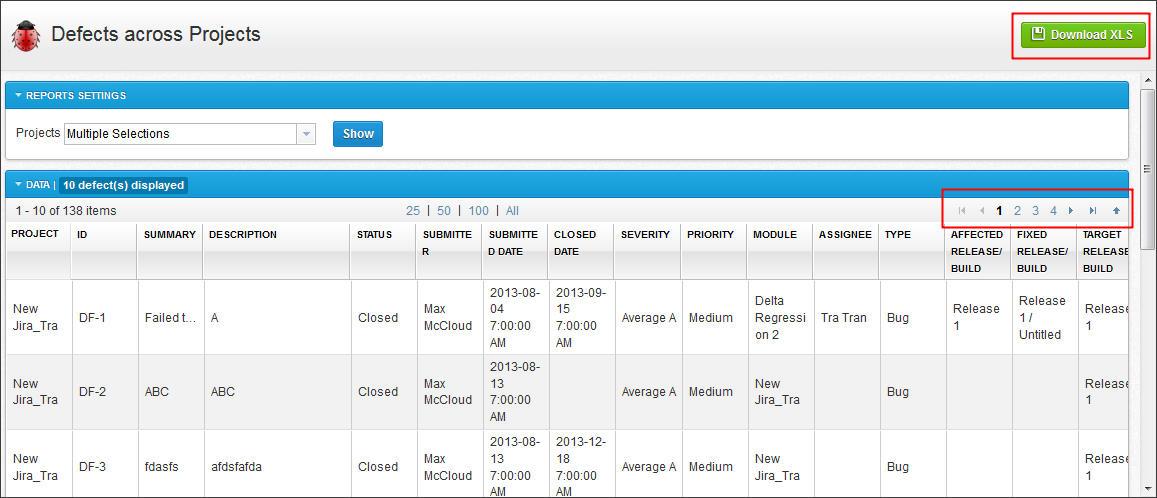
It may take a while for the report to be processed. The result is paging. You can navigate to the other pages to view the data.
-
The report can be exported to an Excel file by clicking theDownload XLSbutton. You can leverage the file for further analysis.
Test Execution Across Projects
This report provides you detailed data of all of Test Execution from multi-projects at the report run time. Follow these steps to view the report.
-
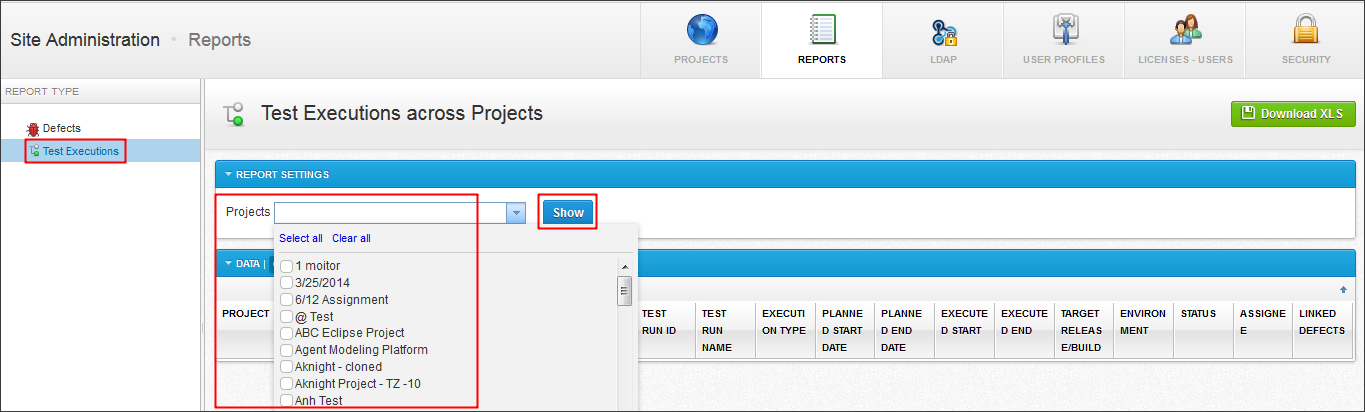
SelectTest Executionsfrom the menu on theleft-handside.
-
By default, the report is loaded with no data. Users must select the project to show the report.
-
After selecting one or more projects from the drop down list, click Show to view the data grid.
-
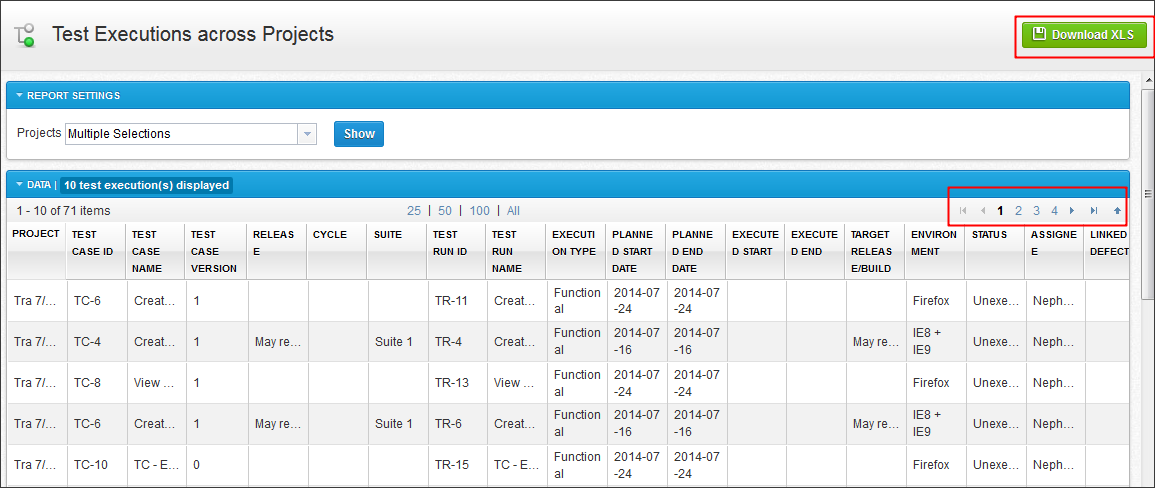
It may take a while for the report to be processed. The result is paging. You can navigate to the other pages to view the data.
-
The report can be exported to an Excel file by clicking theDownload XLSbutton. You can leverage the file for further analysis.
To view those reports on multiple projects, do the following,
-
Create a project group. The project group will have its own values forTest Runs Status,Defect StatusandRelease. The Site Administrator must map the values of each selected project with the group values.
-
Share a project group with certain users or project user profiles.
-
qTest Manager users who have been shared with a project group will see its reports in the Report tab of any accessible projects.
Create a Project Group
-
In the Site Administration page, click the Project Groups tab.
-
Click the+ Add new groupbutton.
-
Click the project group name to rename it.
-
Select which projects to add to the project group by checking on their respective check boxes.
-
Click theMappingbutton.
-
Since each project has its own custom field settings, you must map theTest Run Status,ReleaseandDefect Statusof the project group with the values defined in each project.
-
Aproject group is pre-populated with default value sets forTest Run StatusandDefect Statuswhen it is created. You can edit or define new values by clicking the Gear icon next toTest Run Status,ReleaseorDefect Status.
Editing a Project Group
-
Hover over the desired project group. Click on the Gear icon. You can edit the project group name and add or remove projects to the group.
-
Click theMappingbutton and select the Gear icon next toTest Run Status,ReleaseorDefect Statusto edit their values.
-
Click a display name to rename the value.
Toggle the Active check box to activate and deactivate the value.
ForTest RunandDefect Status, you can select a color to represent the value.
Re-order or remove a value by clicking on the corresponding icons in theActioncolumn.
Click + Add Valueto add new custom values.
Select project values from the corresponding drop down box. One project group value can be mapped with multiple project values.
One project value cannot be mapped to multiple project group values. You must map the project group's values ofTest Run Status,ReleaseandDefect Statuswith the values from each selected project. To delete a Project Group, hover over the desired project group. Click on itsxicon.
Sharing a Project Group
For a user to view the cross project reports of your project group,the project group must be shared with the user.
-
Hover over the project group you want to share and click theshareicon.
-
TheShare Project Grouppop-up displays. Select specific user profiles or users with whom you want to share the project group. Click theAddbutton to add them to the grid.
Each selected profile or user will be added as one record on the grid.
-
Shared with specific user profiles:Users can view cross project reports in the Report tab of any projects to which they have access with the specified profiles.
-
Shared with individual users:These users can view cross project reports in the Report tab of any projects they have access
-
To unshare a project group, do the following.
-
Hover on the project group you want to share and click on theshareicon. On the grid, hover over the desired user or profile. Click theXicon to remove it.
"
Viewing Cross Project Reports
These reports show data based on the project group defined by the Site Admin. Once the project group has been created and shared with users, these users can view reports by doing the following.
-
Select a qTest Manager project.
-
Select the Reporttab on the top navigation.
-
On theleft panel, click Cross Project Reportsto expand it. You will see all project groups shared with you.
-
Expand the folder of a project group and select a report you want to view.
IMPORTANT:For now, our reports have not supported defects tracked in the external system. If your projects are integrated with an external defect tracker, the report will show no defect.
Test Execution Summary
This Report provides the Test Execution details at report run time. The report can be filtered byReleaseandTest Run Type. To view this report, follow these steps.
-
SelectTest Execution SummaryReport under a project group from the left menu.
-
Select aReleaseand aTest Execution Type.
-
Click theShowbutton to view the report.
In the Report Settings section, you can select oneReleaseand oneTest Execution Typeto filter the report.
The Latest Information section shows the current number of Test Runs and the detailed number of Test Runs being grouped by the laTest Execution results in the selected Release. Execution result values are defined in the Project Group's settings and are mapped with the project values.
The Chart and Legends area shows your Test Execution data reported in the form of a Pie Chart. The chart shows the portions of the Test Runs grouped by their laTest Execution results.
In addition to the Chart, the report provides a detailed table of each Test Execution that meets your selected filter.
You can export the grid to an Excel file. The file can be exported to different formats such as XLS, PDF, and CVS. Click the Mail button to receive an email containing the exported report.
Testing Velocity
This Report provides the Rollup of time per Test Execution to a test suite/cycle/build/Release and the difference between planned and actual time.
-
Select theTesting VelocityReport under a project group from the left menu.
-
Filter the report byReleaseandTest Run Type.
-
Select aTime Unitto display Execution Time in the report.
-
Click theShowbutton to generate the report.
In the Report Settings section, select a Release and a Test Execution Type to filter the report. Select a Time Unit to display the data.
The Summary with Latest Information section shows the latest information for execution time in four terms.
-
Total Planned Time:Sum of planned execution time of all Test Run Logs in the selected Report Settings.
-
Total Actual Time:Sum of the actual execution time of all Test Run Logs in the selected Report Settings.
-
Planned Time:Sum of planned execution time of all latest Test Logs of Test Runs in the selected Report Settings.
-
Actual Time:Sum of actual execution time of all latest Test Logs of Test Runs in the selected Report Settings
The Data Grid contains a detailed Report of Test Execution Time.
You can export the grid to an Excel file. The file can be exported to different formats such as XLS, PDF, and CVS. Click the Mail button to receive an email containing the exported report.
Execution Status with Defects
This report provides an overview of the execution status of a specific Release along with the total test cases executed and their associated defects.
-
Select theExecution Status With Defectsreport under a project group from the left menu.
-
Select a specificReleaseand aTest Case Type.
-
Click the Show button to view the report.
In the Report Settings section, select a Release and Test Case Type to filter the report.
The Data Grid contains the detailed data of the test cases that were executed and their associated defects.
You can export the grid to an Excel file. The file can be exported to different formats such as XLS, PDF, and CVS. Click the Mail button to receive an email containing the exported report.