Desktop Explorer Quick Start Guide
The qTest Explorer Quick Start Guide gives users a quick and easy way to begin running exploratory test sessions.
Desktop Explorer Features
Supported platform: Windows
-
Record user actions for a planned or new session
-
Support various capture modes: Auto, Manual, Interval
-
Add notes in the middle of recording progress: plan text, audio/video
-
Capture screenshot: Full screen, Active window, Custom region, Selected region, Scrolling window
-
Edit recorded session
-
Annotate screenshot
-
Export to various file formats: .trace, MS Word, PDF, JPG
-
Email session
-
Submit defect to defect trackers: qTest, Jira, Rally, VersionOne, Hpqc
-
Generate/Update test case to qTest
-
Automatically upload recording session to qTest’s Session Manager
-
Always On: automatically start recording when specific applications are launched
-
Auto Update: detect for new version and prompt for upgrade
-
Can be launched from qTest’s Session or Test Execution module
Explorer permissions
The following qTest Project permissions are found in the Session Manager section on the User Profiles screen.
-
Create Session. Allows you to record a new session on both Web Explorer and Desktop Explorer. Explorer creates a session in qTest Sessions and Manager.
-
Update Session. Allows you to record a planned session created earlier by a Project Admin in qTest Sessions.
-
View Session. Only applicable to qTest Sessions. This option has no impact on Web Explorer or Desktop Explorer functionality. If this permission is not applied, you will not have access to qTest Sessions.
-
Delete Session. Only applicable to qTest Sessions. This option has no impact on Web Explorer or Desktop Explorer functionality.
Log In
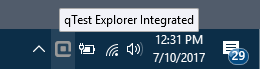
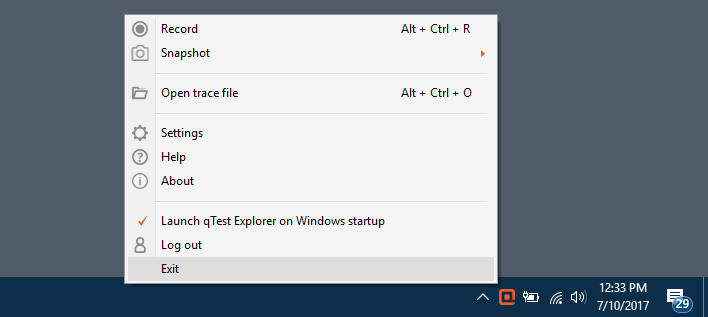
After you Download and Install Desktop Explorer, you can launch the application and access it via your desktop system tray.
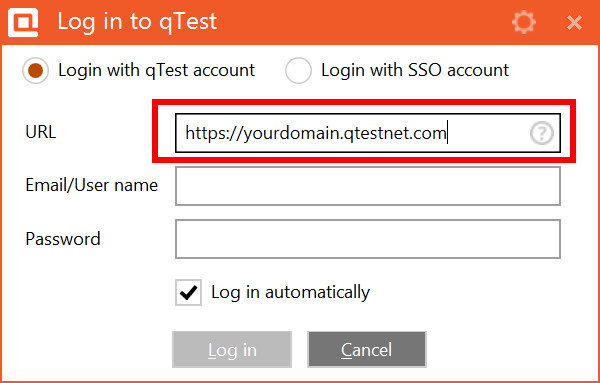
To log in, click the Desktop Explorer tray icon, as shown below.
When entering your URL, you must use syntax "https://yourdomain.qTestnet.com" to successfully log in to Explorer.
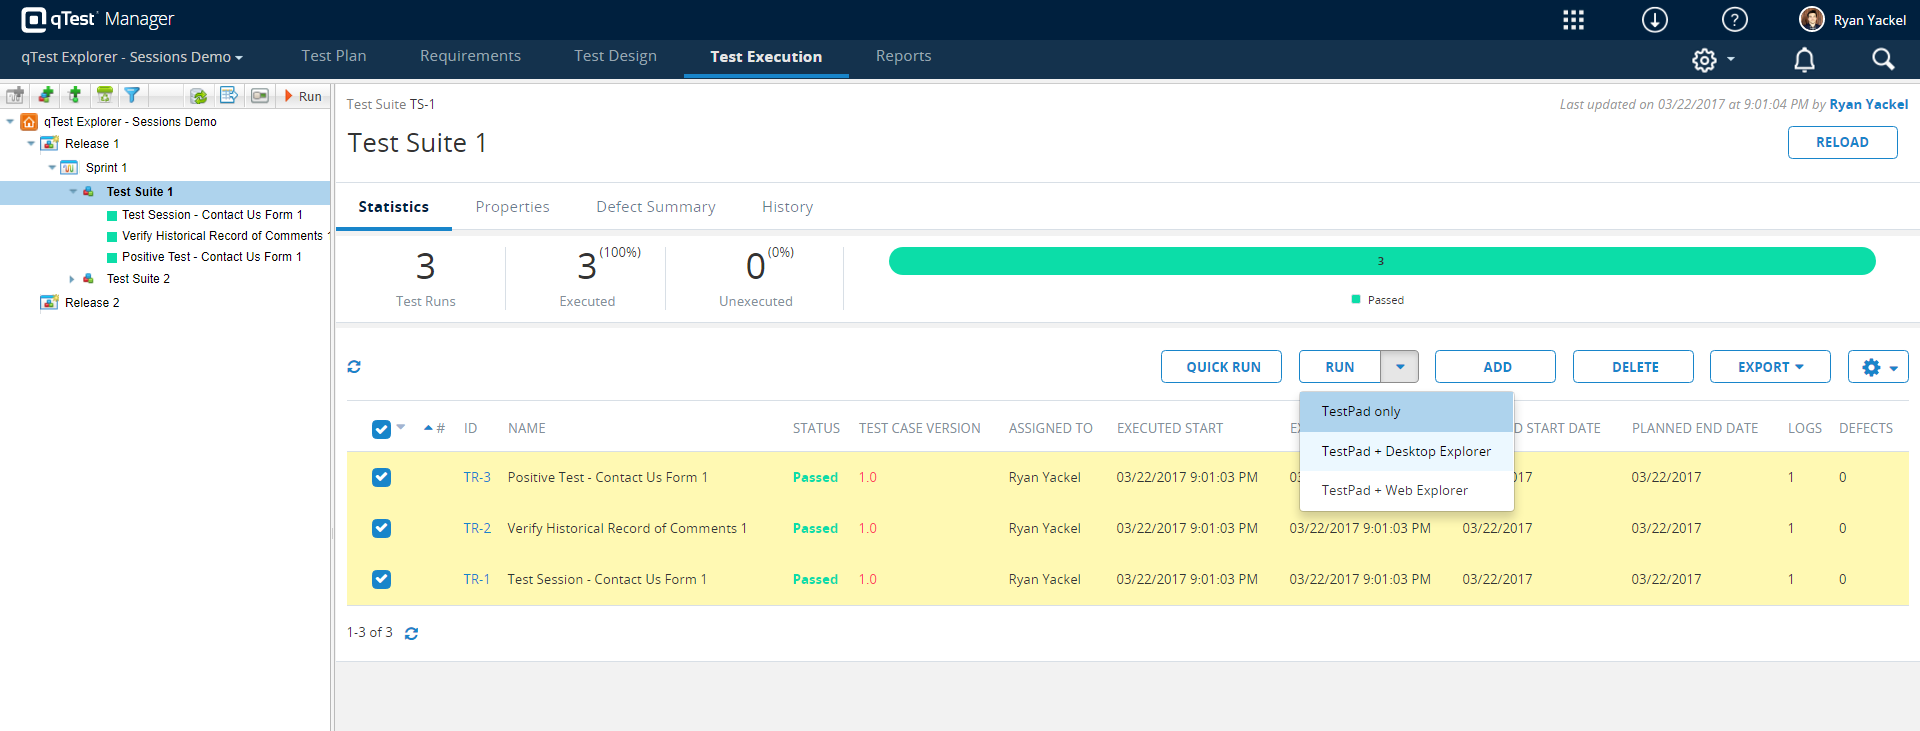
Launch Explorer
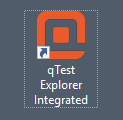
You can launch Explorer through a desktop shortcut, the Test Execution module in qTest Manager, or the Sessions Module.
-
Launch through desktop
-
Launch test session in qTest Manager
-
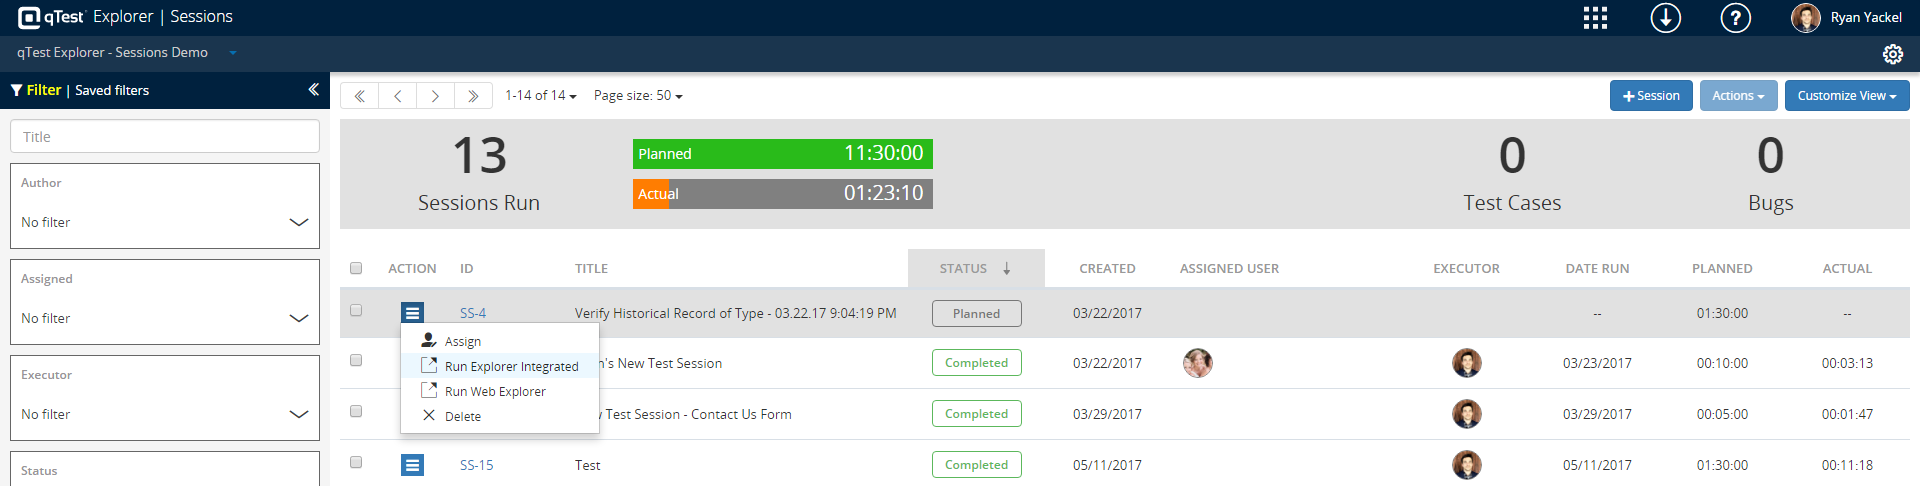
Launch through Sessions Module
Record Test Session
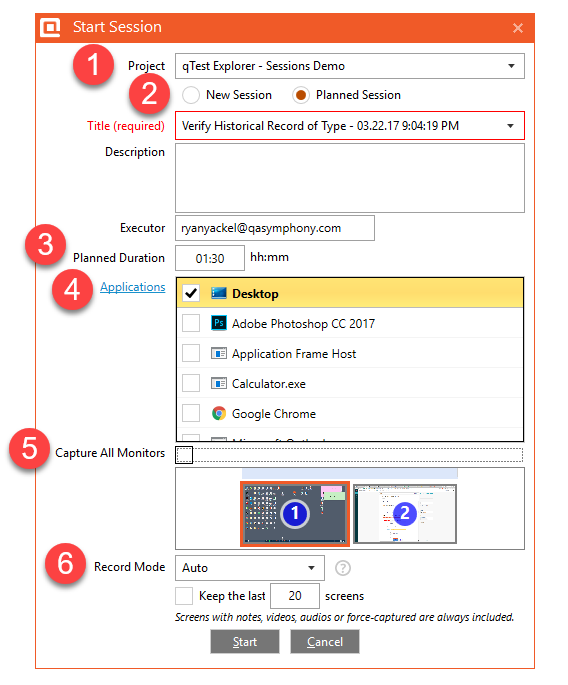
After you have launched qTest Explorer, you are ready to record your test session. A Start Session window will appear that allows you to select the below options:
-
Select project for session storage.
-
Record a new session or select a planned session that was created in the Sessions Module.
-
Logged your planned duration.
-
Select which applications you want Explorer to record.
-
Choose which monitors Explorer can capture.
-
Select a recording mode.
By default, qTest Explorer's recording mode will be set to Auto. This means that Explorer will capture every keystroke, mouse click, data input, and screen change when your session begins.
Once your session has been started, you will see the Explorer widget open on your desktop. You can keep the widget front and center while you test or move to a separate location on your monitor.
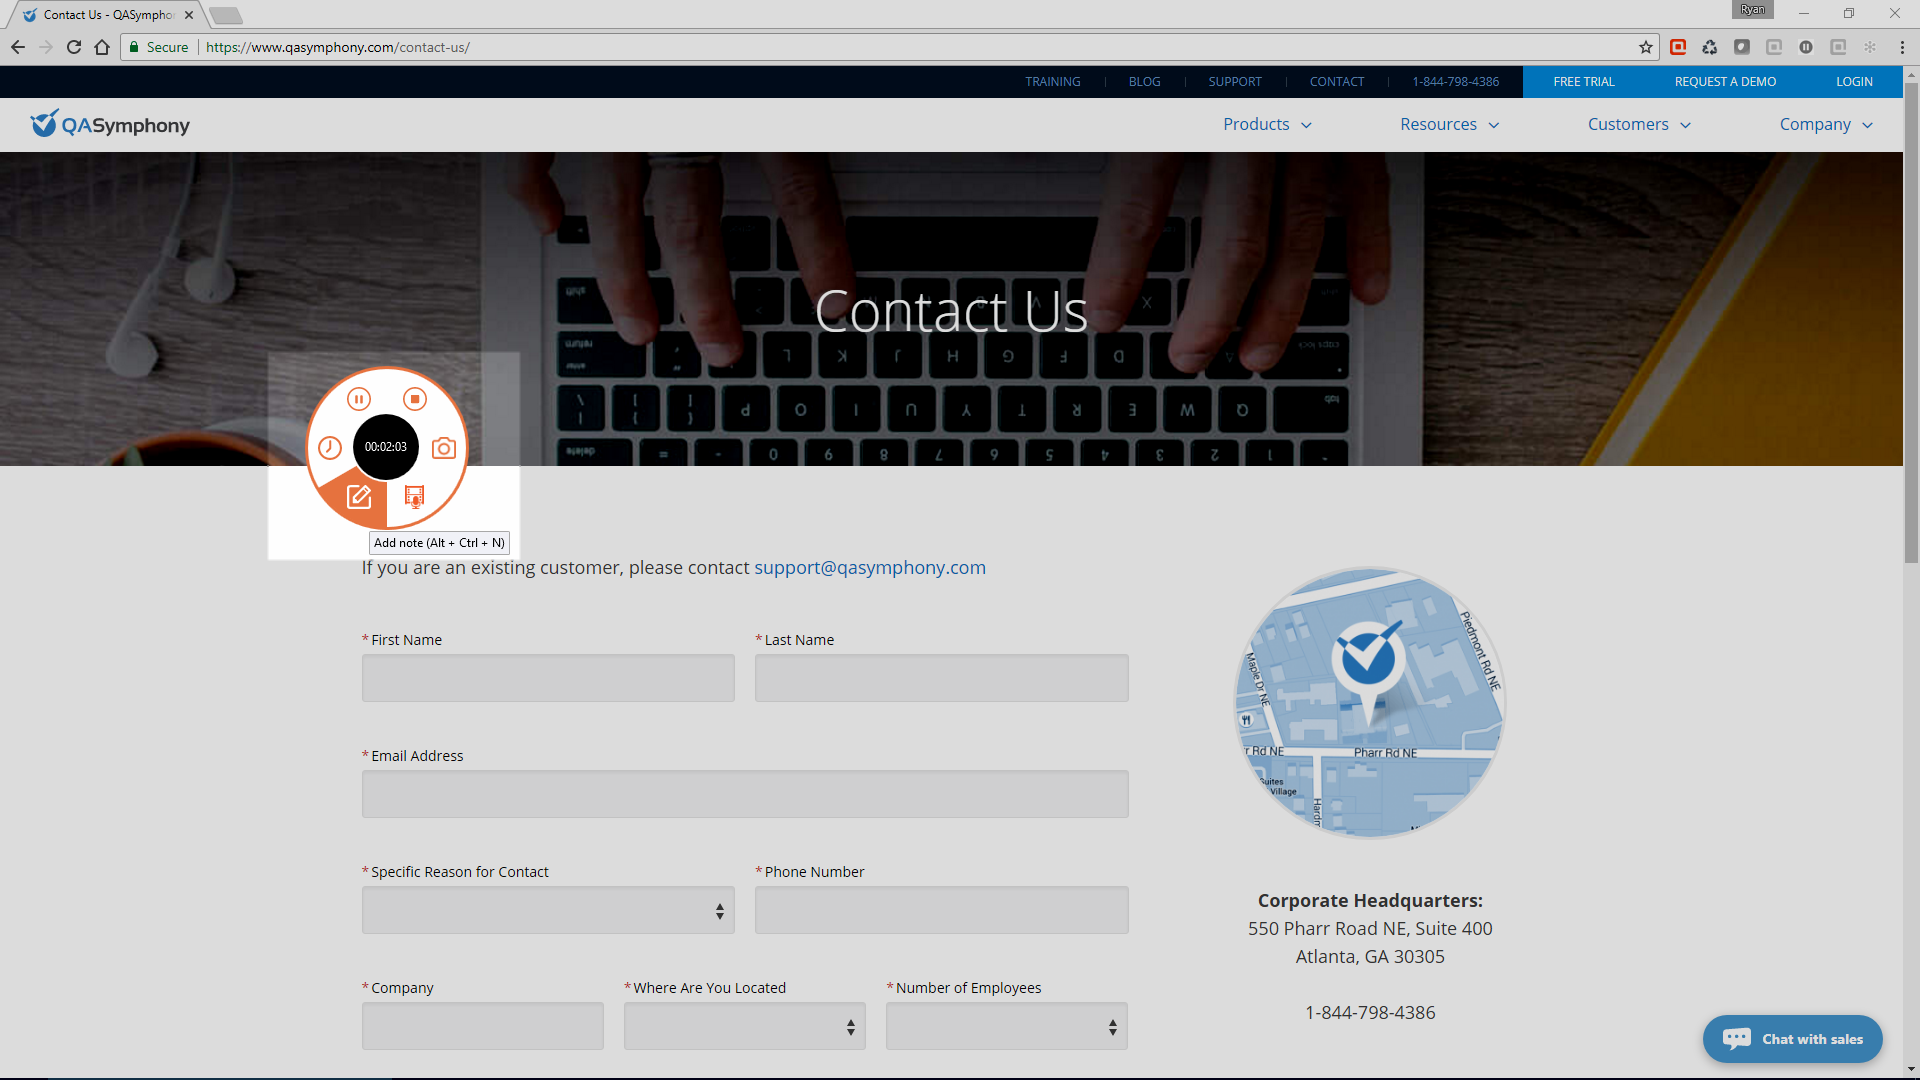
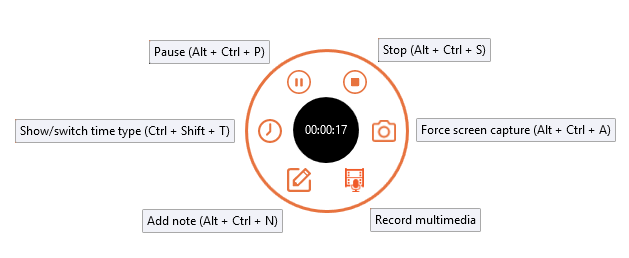
There are multiple actions you can take when recording with qTest Explorer. Whether you need to take a note, force a screen capture, record a quick video, or log your testing time, qTest Explorer contains all the actions you need for exploratory testing.
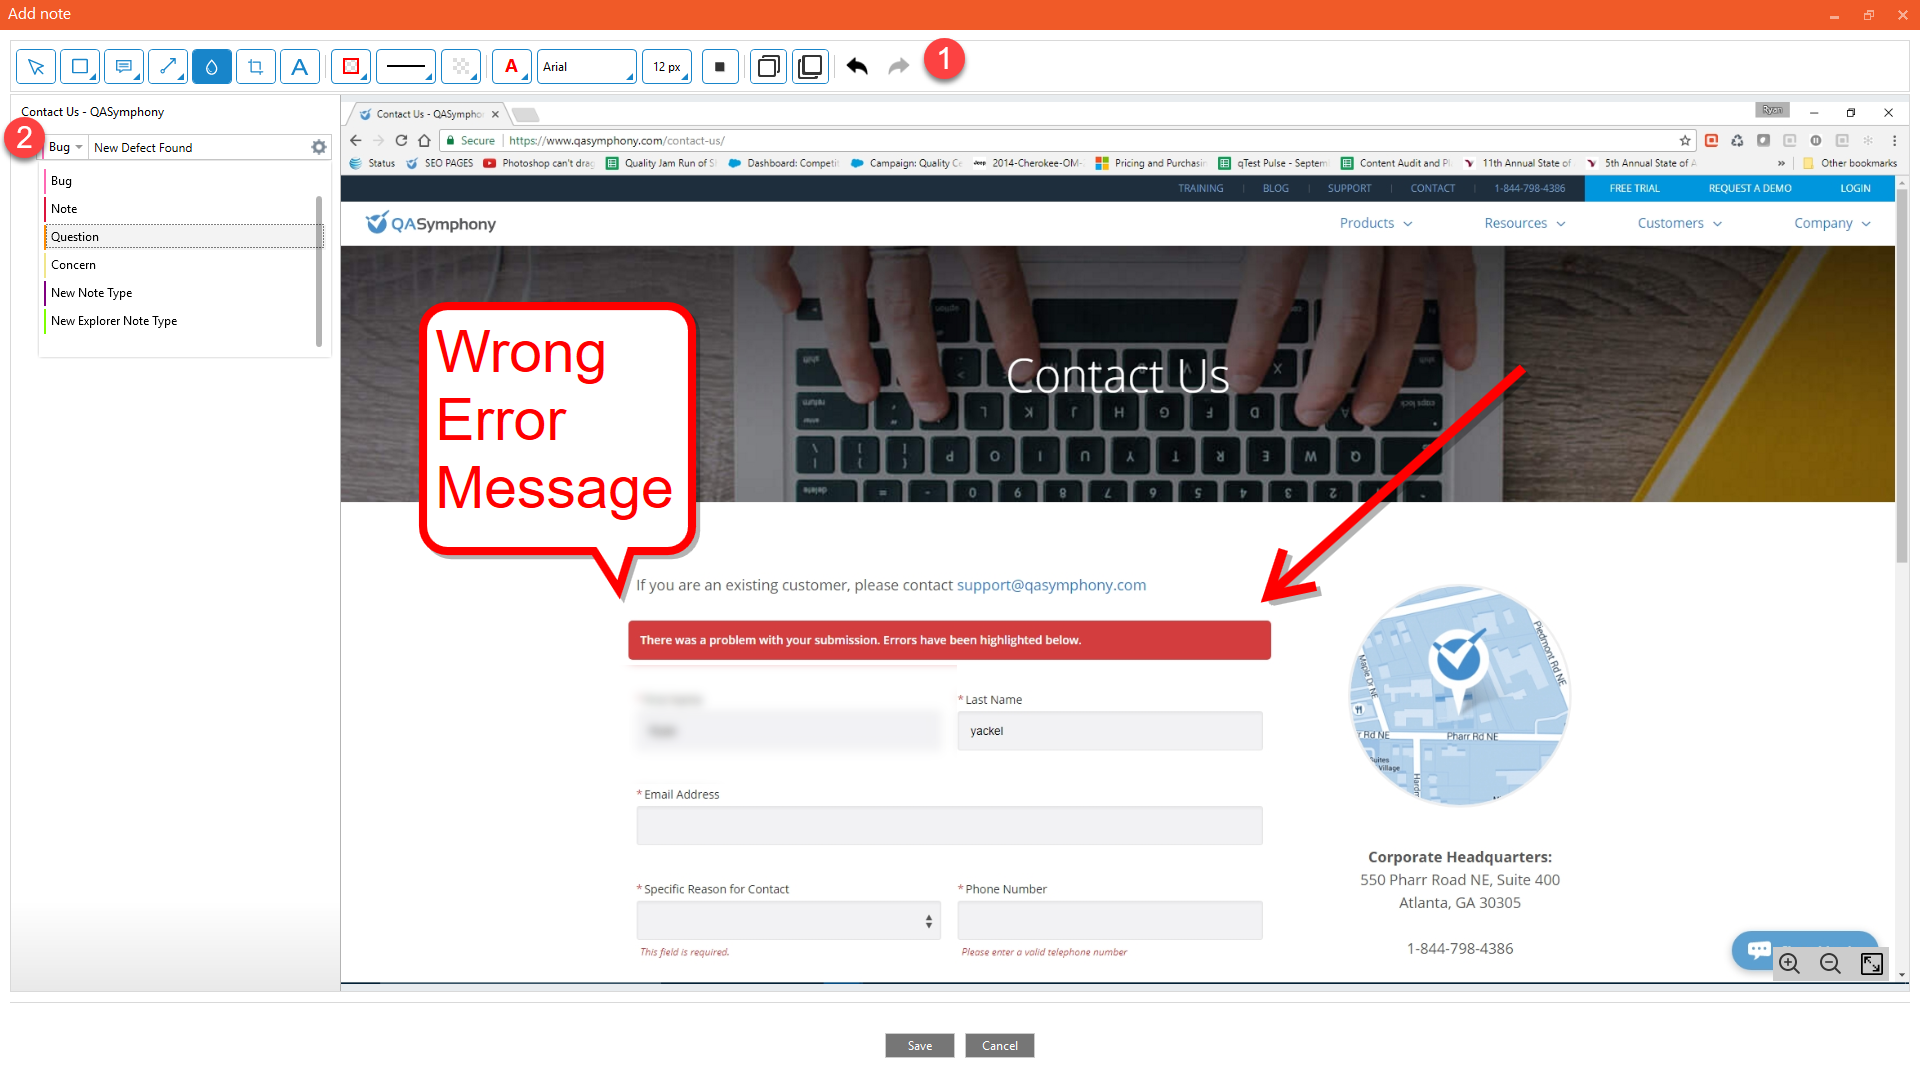
Add Note
Adding a note during your test session allows you to freeze the screen and enter an annotation mode to start detailing what your testing eyes are seeing. This could be a bug, opportunity, or feature suggestion that you want to share with your team.
-
Add annotations (i.e. text, blur, callouts).
-
Log notes.
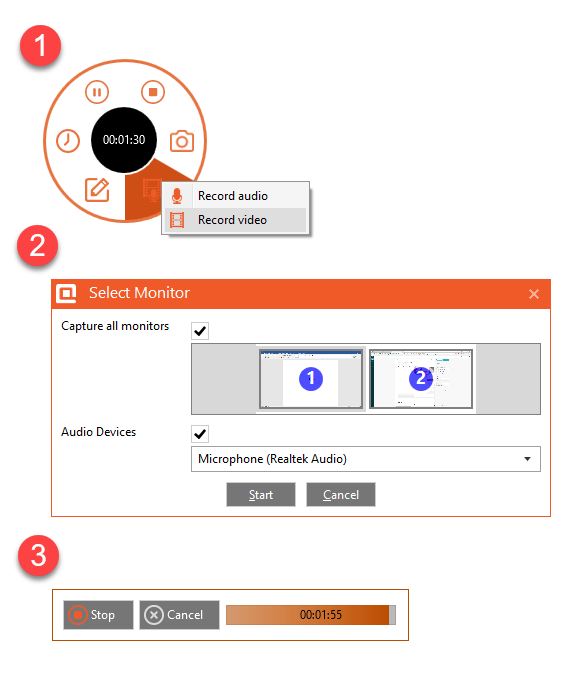
Record Video
By selecting record multimedia, you can record both audio and video from your screen. This allows you capture dynamic images and screens for test documentation.
-
Select record multimedia.
-
Select monitors to record.
-
Pause and end recording.
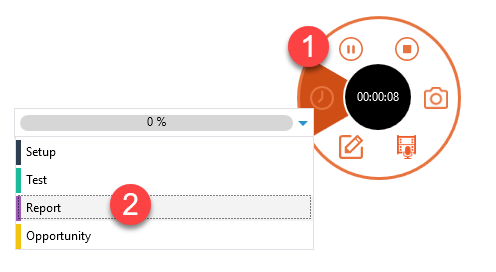
Log Time
Logging your testing time allows you to see the breakdown of all test activities related to your exploratory test session. For example, you might be logging too much time investigating opportunities when you should be reporting bugs found.
-
Select add time type.
-
Select time type.
Time types can be changed in the qTest Explorer project settings.
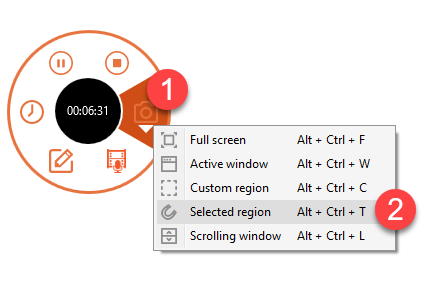
Force Screen Capture
Even though Explorer will automatically record every action you take, you may need manually capture the changes on a screen. The Force Screen Capture mode allows you to select the full screen or a selected areas to pinpoint your attention.
-
Select Force Screen Capture.
-
Choose capture type.
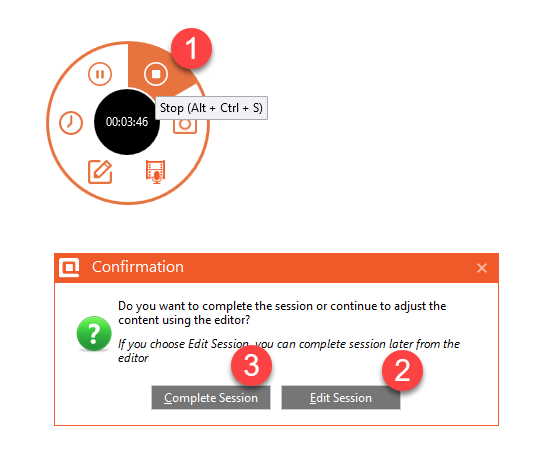
Stop Session
To stop your test session, click the Stop icon on the Explorer widget.
-
Stop Session.
-
Clicking Edit Session will allow you to edit your session on your desktop.
-
Clicking Complete Session will send your results into the Session Module for further review and edits.
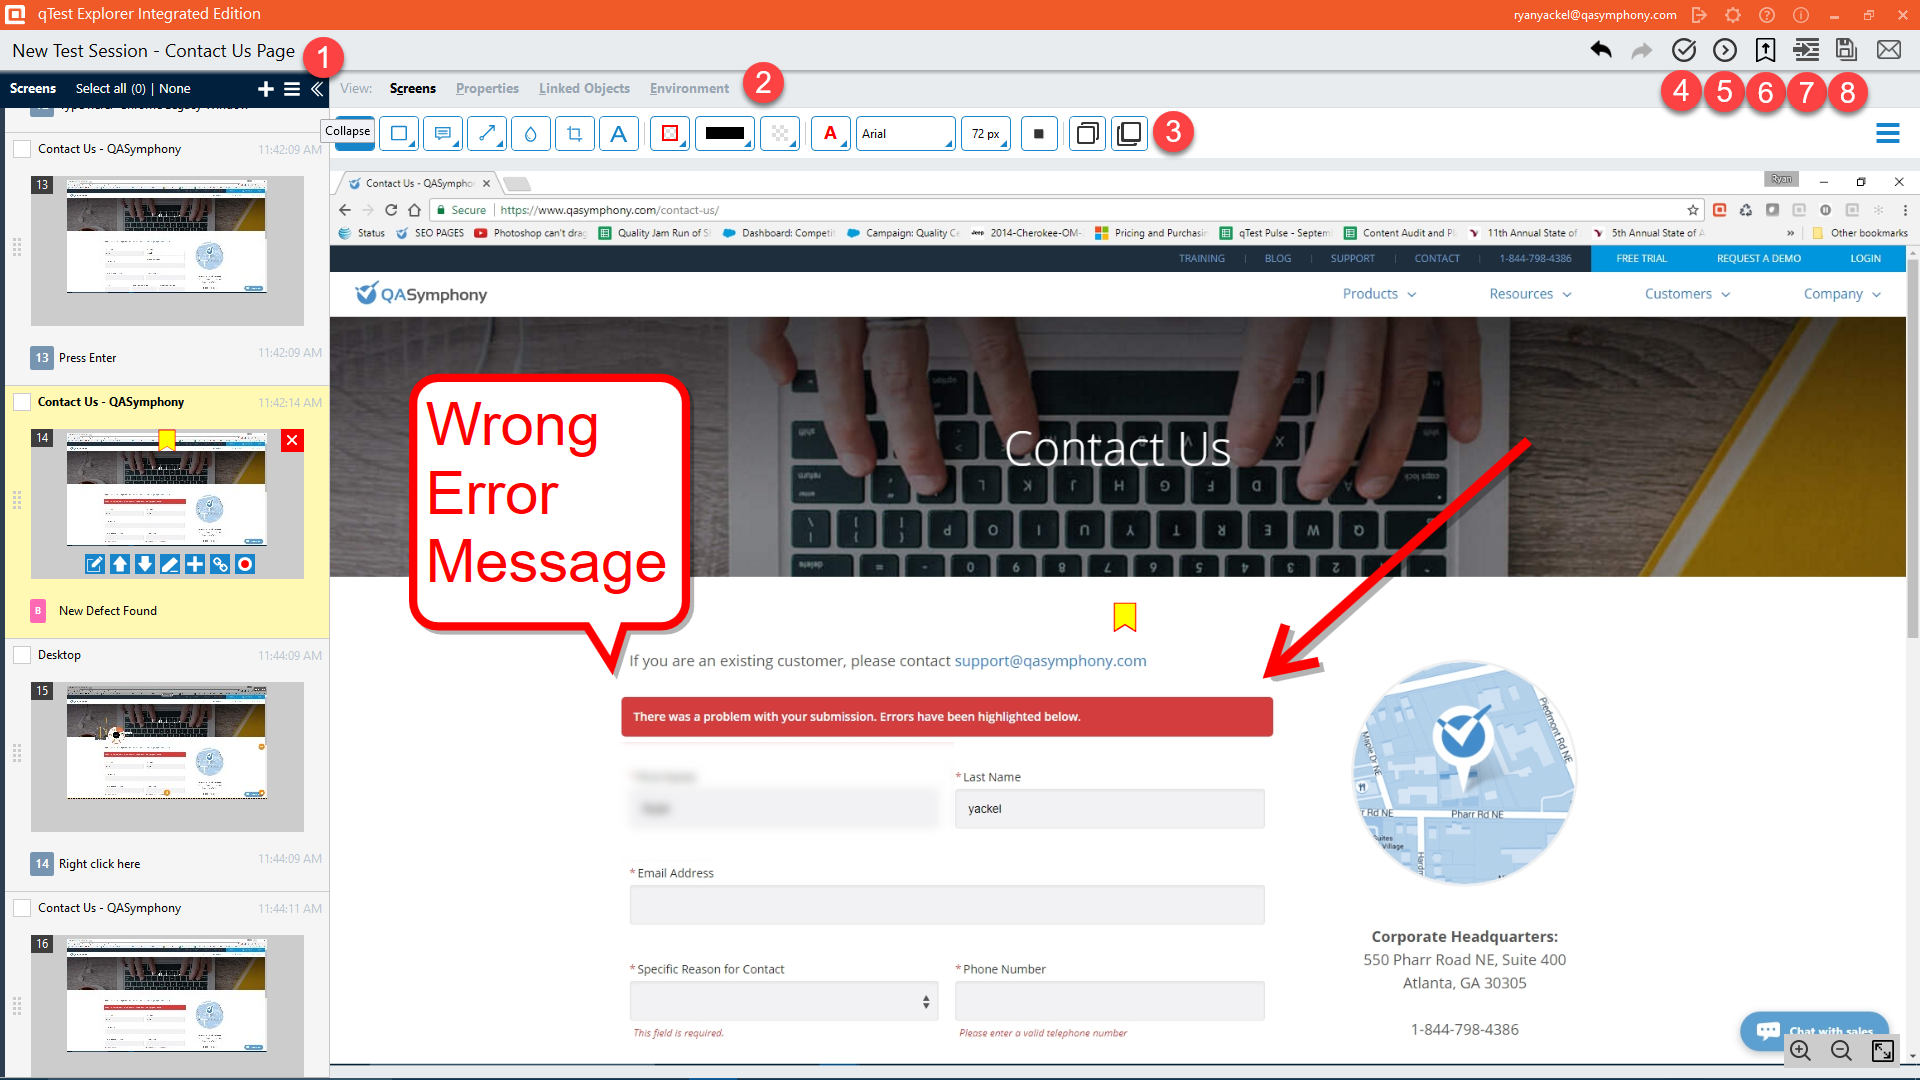
Review on Desktop
Once you stop your test session, you will move into an editor mode that will open on your desktop. From here, you will be able to edit and review all data recorded in your test session.
-
View all screens.
-
See environment details (i.e. OS, browsers).
-
Annotate.
-
Complete session.
-
Continue session.
-
Submit defect.
-
Create test case.
-
Save documentation locally.
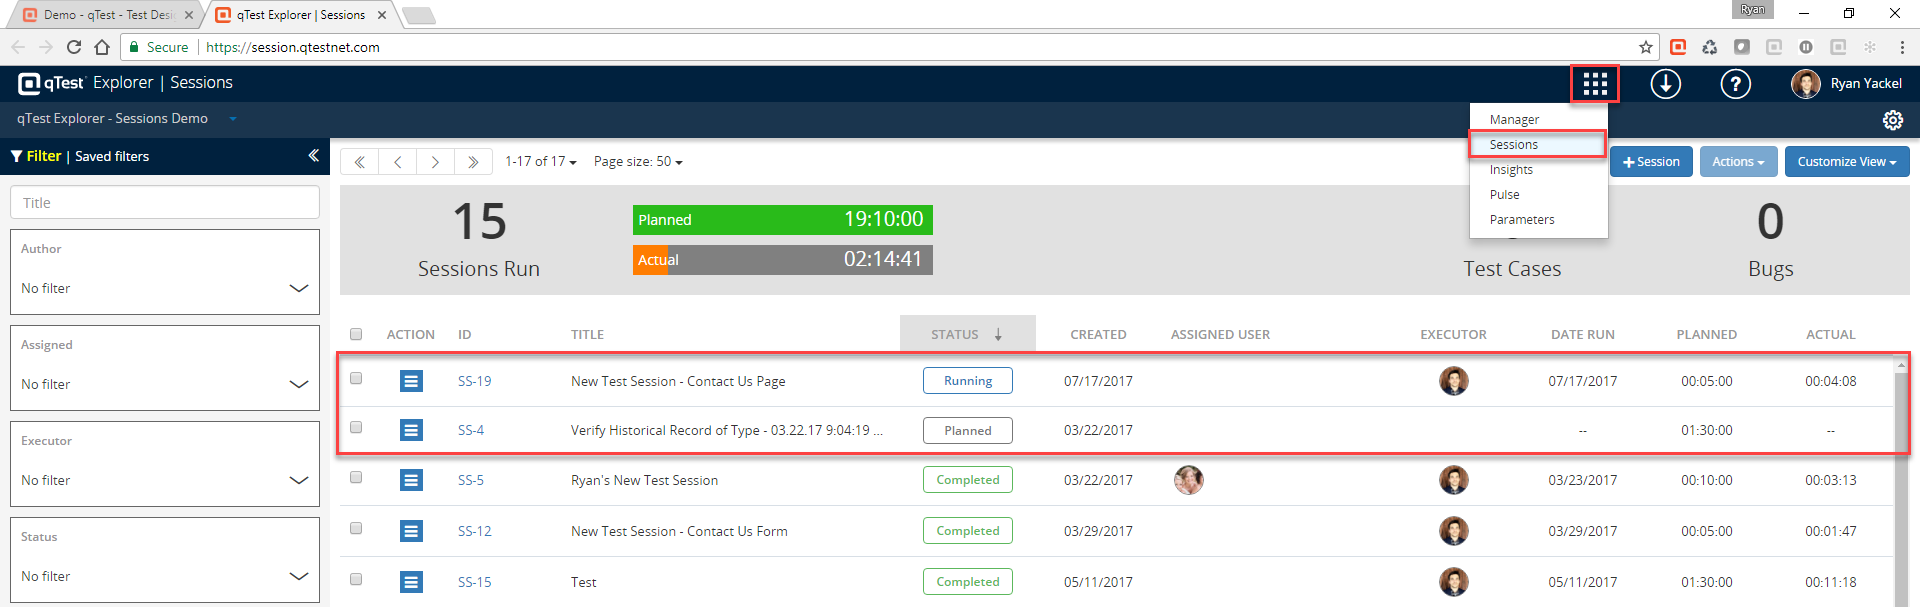
Review in Sessions Module
As soon as you click Complete Session, you will be sent directly to a web browser to review your results. Click Sessions Module to learn more about managing and editing your test session in the browser.
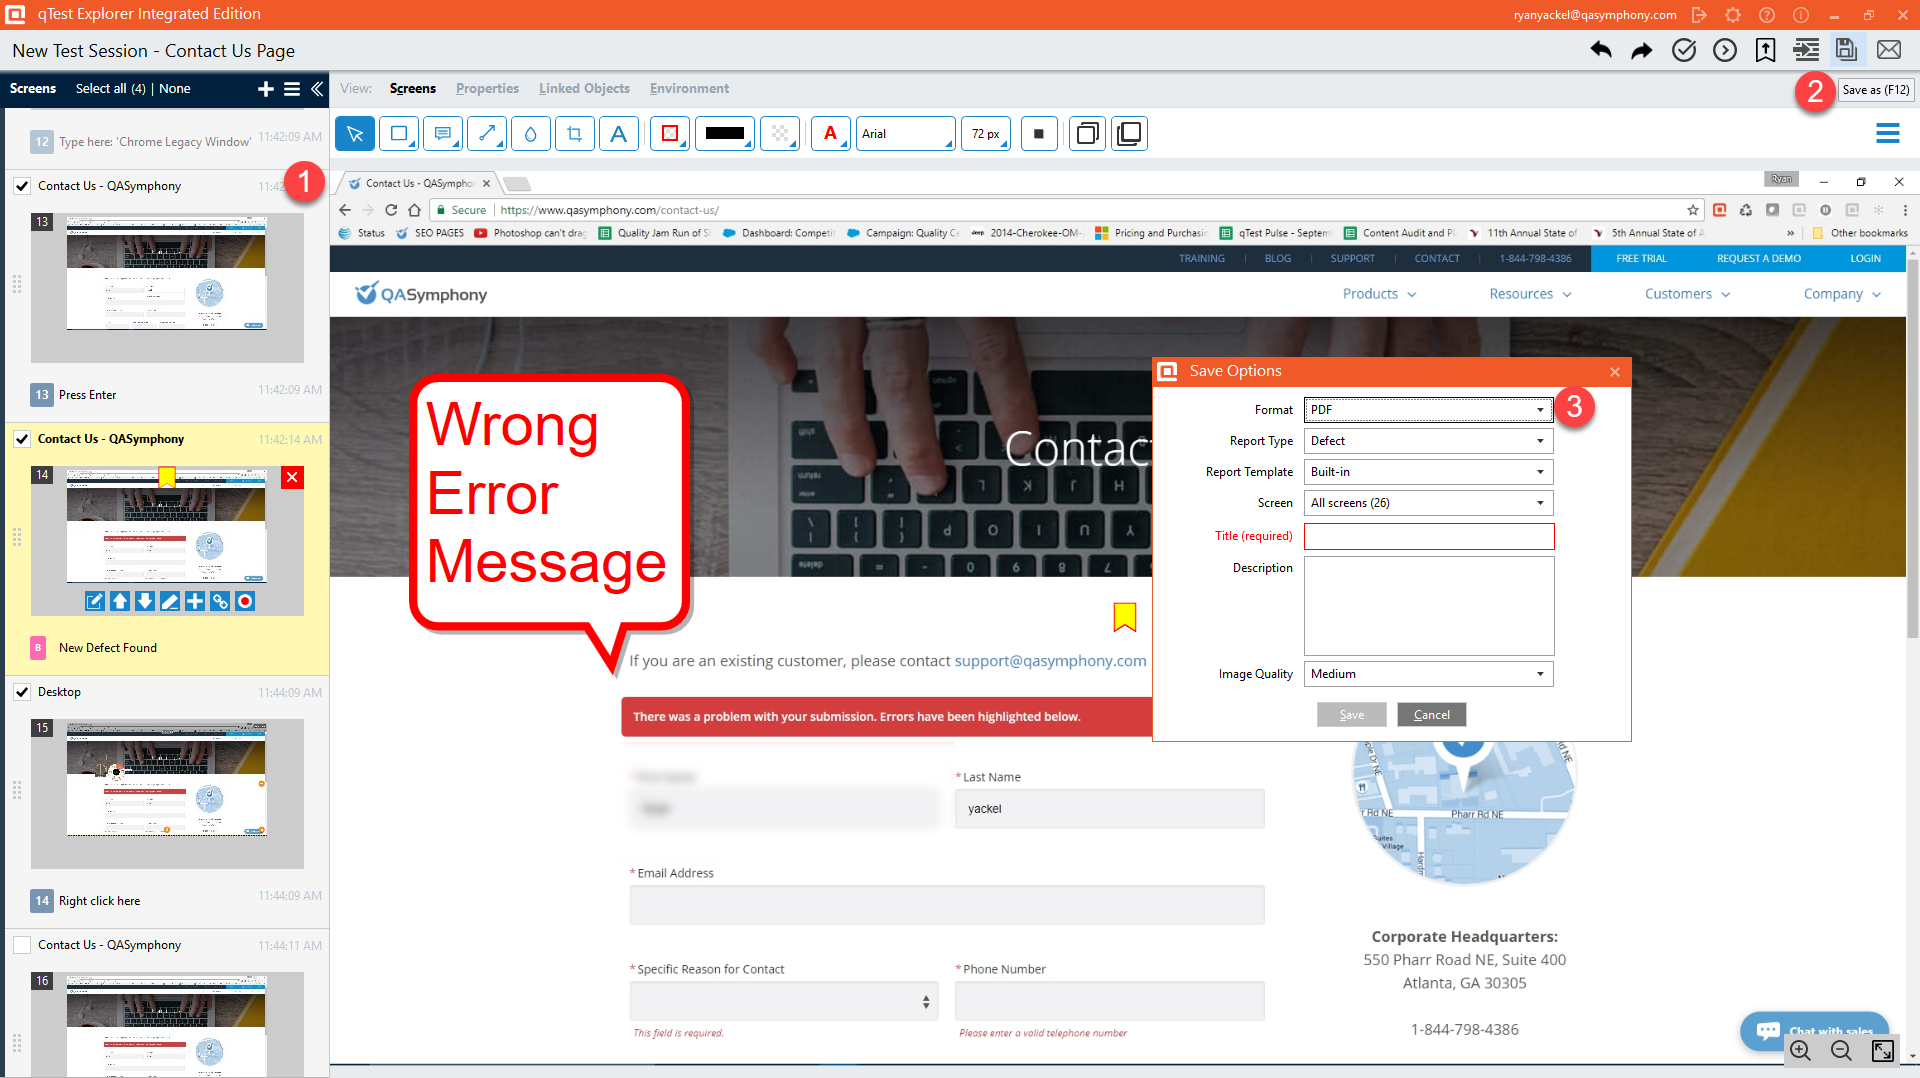
Submit a Defect
After reviewing screen captures and make more annotations, users can quickly submit defects including all the steps with screen captures of their session.
-
Select the screens you want to include for defect reporting.
-
Click the Submit Defect icon.
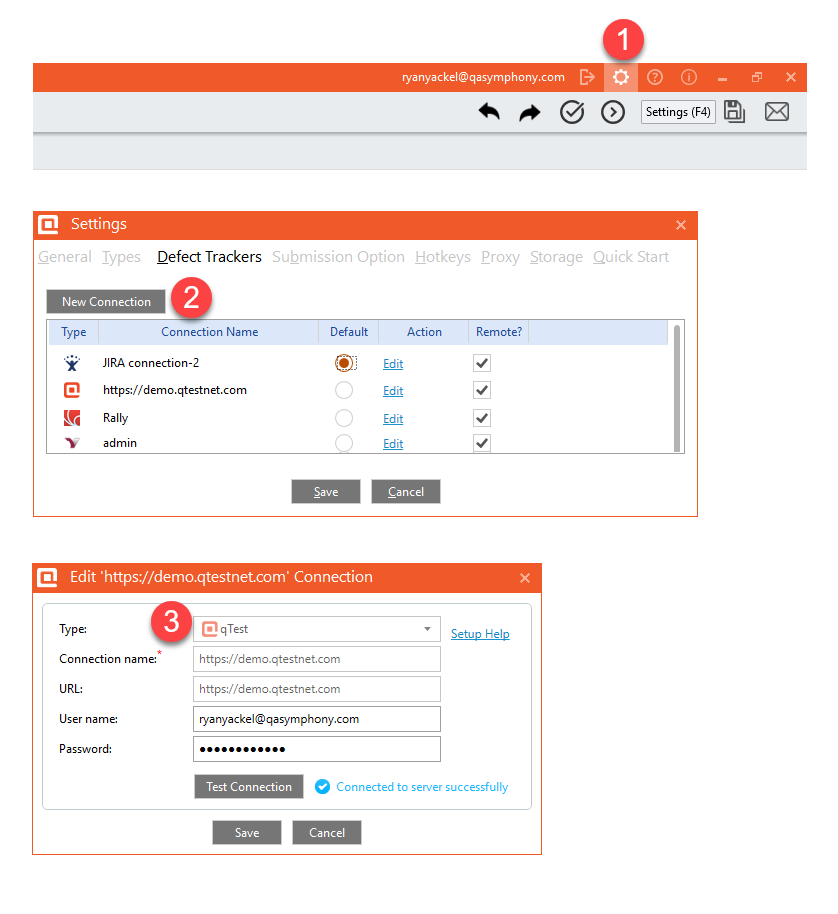
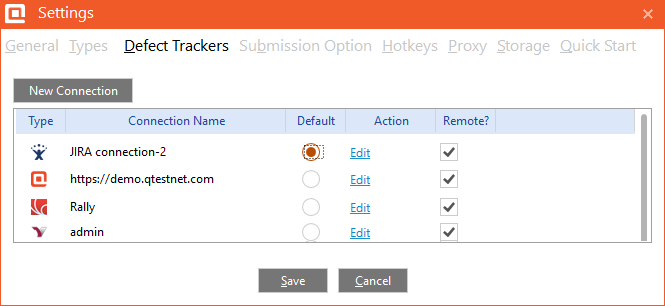
Defect Settings
If you receive the below error, you will need to select your Explorer settings to add a new defect integration.
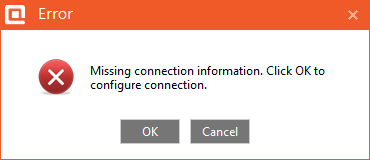
Explorer's default integration will be with qTest Manager; however, you can add a new connection with an external system like Jira.
-
Defect trackers in the setting icon.
-
Add new connection.
-
Insert connection credentials.
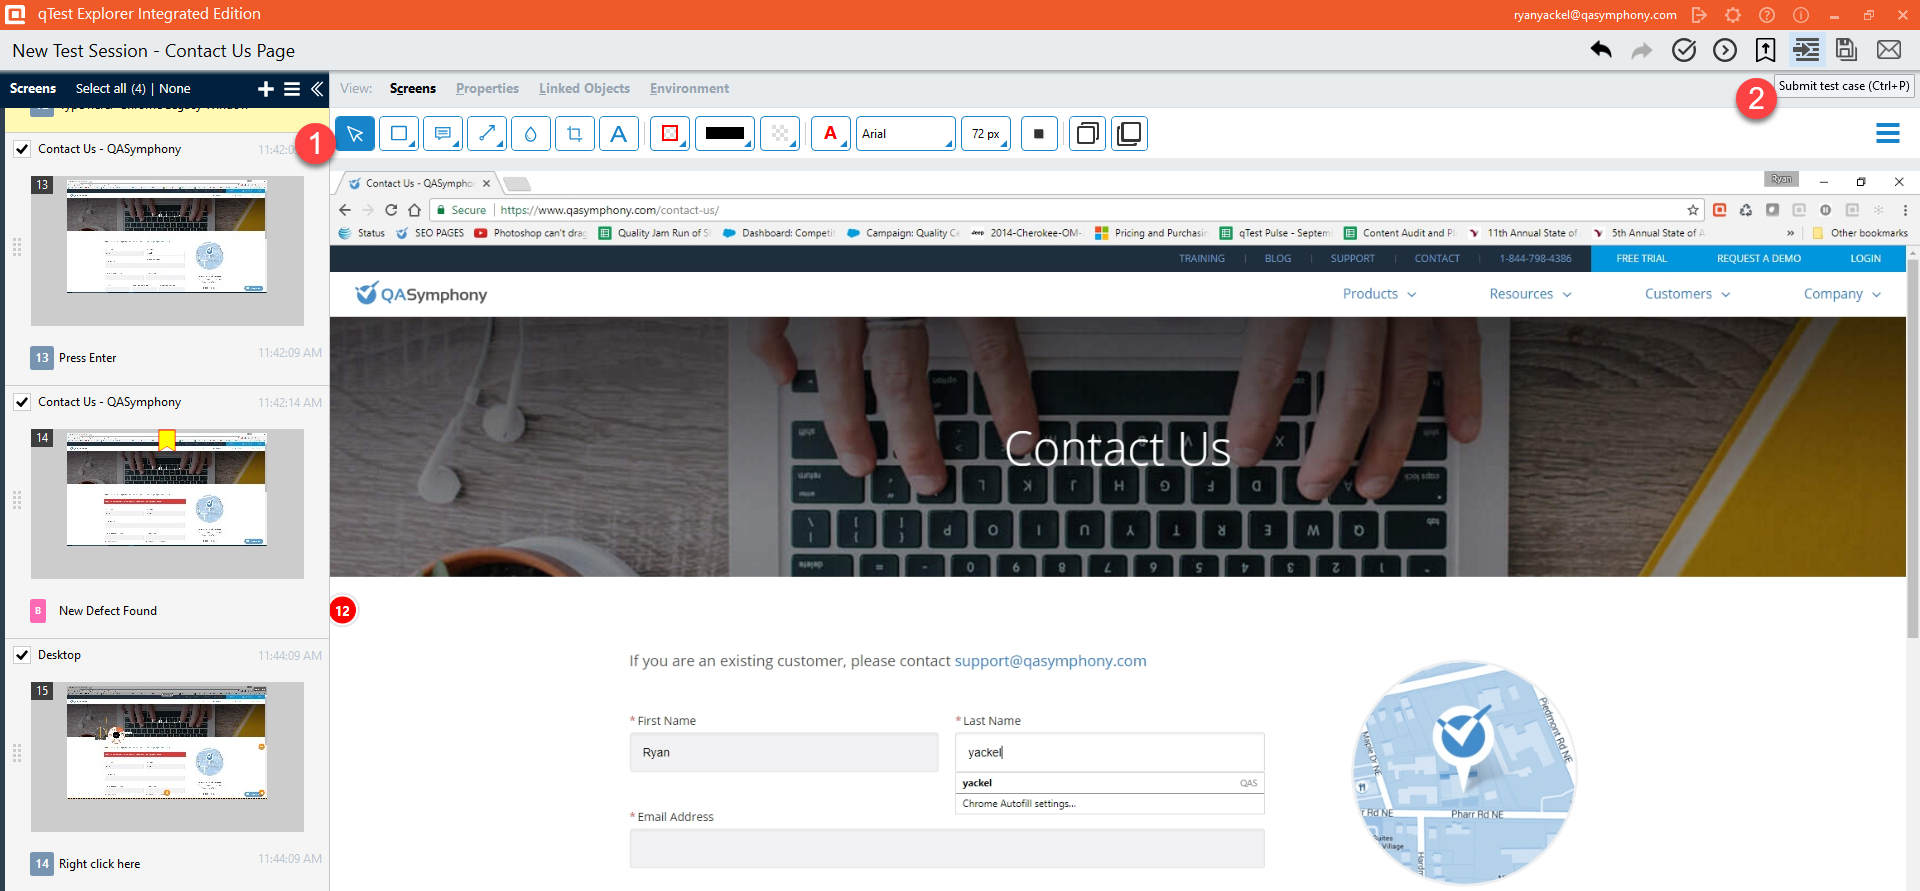
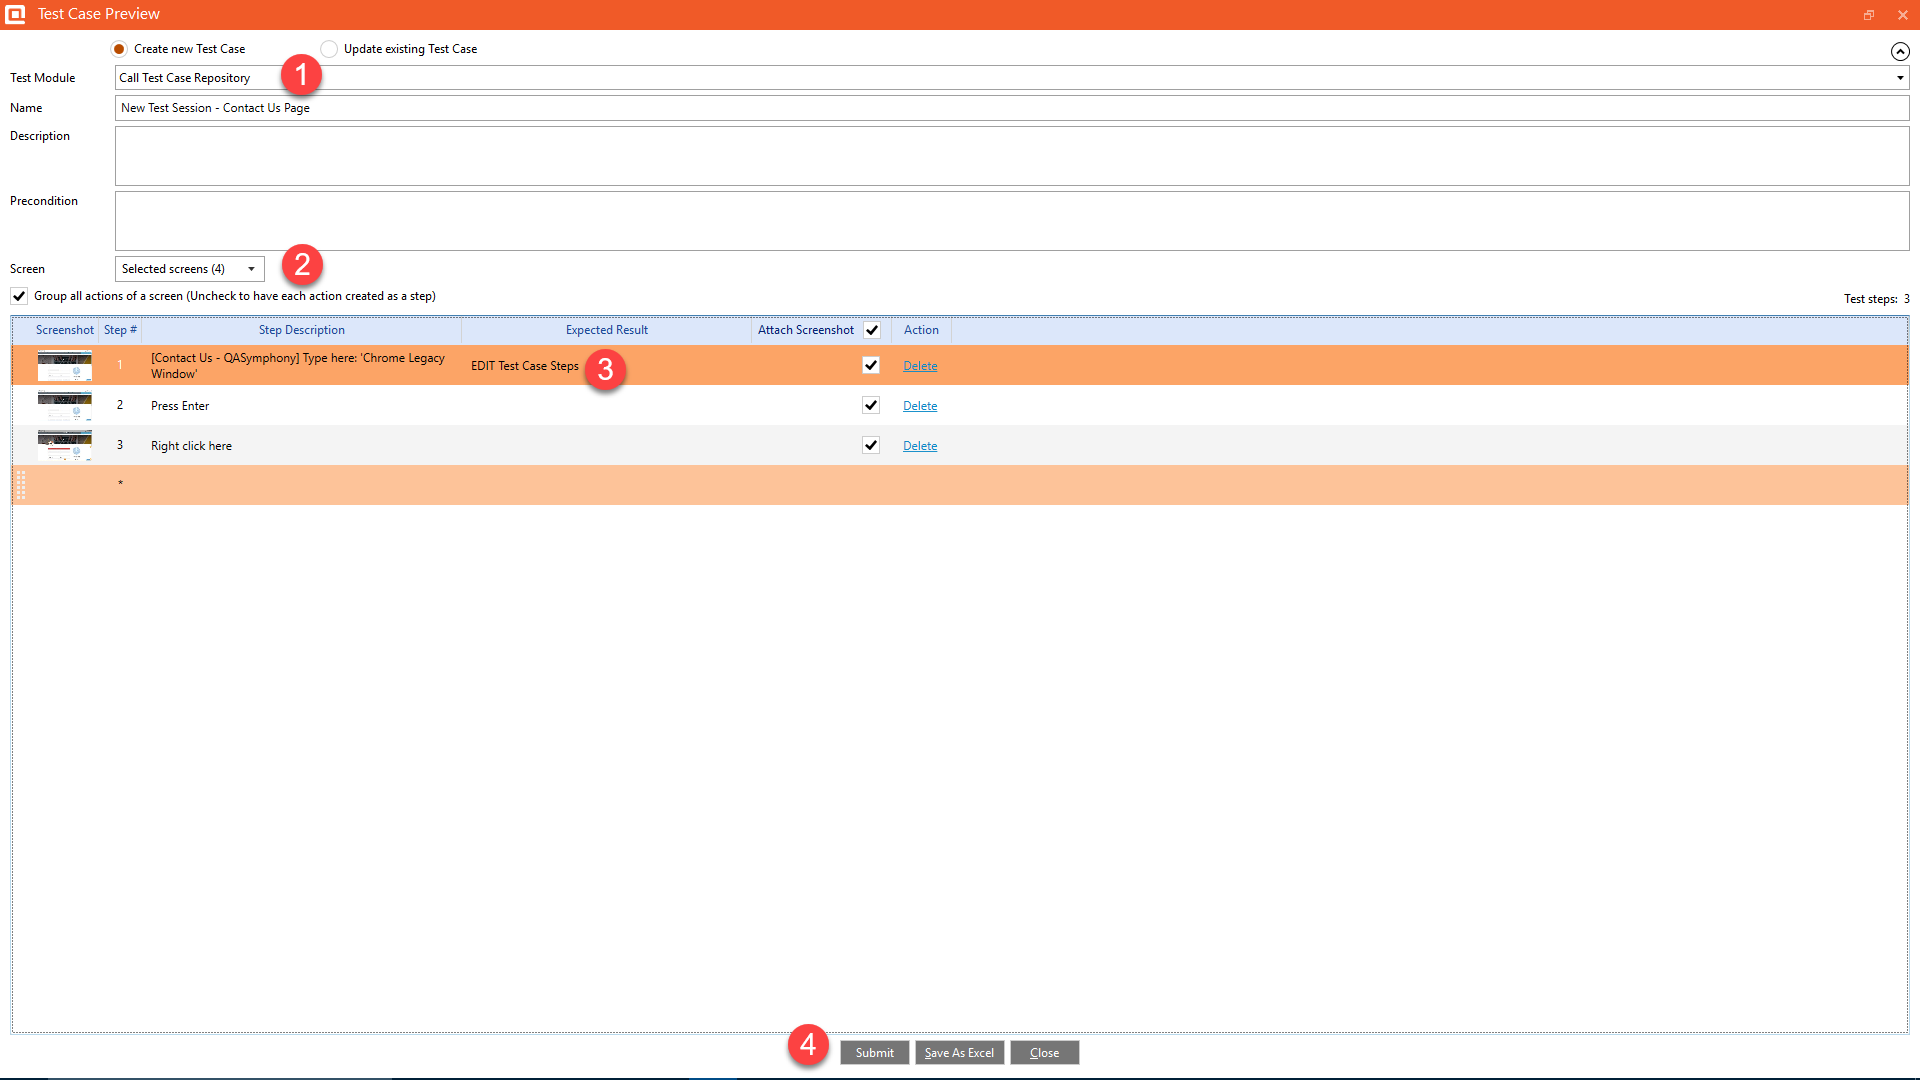
Create Test Case
Explorer will automatically turn your detailed test documentation into manual or automated test scripts. Manual test scripts will be stored in the Test Design module of qTest Manager.
-
Select screens and steps.
-
Click the Submit Test Case button.

-
Select folder for test case storage.
-
Preview screens.
-
Make edits to test case steps.
-
Submit to qTest Manager or save as an Excel file.
Save Results
Users can save their Explorer results in multiple formats to share with their team. These results can then be attached to Test Runs within qTest Manager or saved to another central location for your team.
-
Select screens.
-
Click Save As.
-
Choose file format.
Generate Automated Script for a Desktop Explorer Session
Once you have completed a Desktop Explorer Session, you are able to generate an automated script from the Sessions Module.
For more information on how to create your first automated test script, see the Automated Script Generator article in Sessions Module section of the support site.
Configure Settings
qTest Explorer integrates with qTest Manager for defect reporting and test case creation. However, you can also choose to integrate with popular Agile ALMs like Jira. CA Agile, and VersionOne.
This is done by accessing defect trackers in Explorer's desktop settings or by selecting the project settings with qTest Manager. You can right click on the desktop toolbar or within the Explorer editor.
Select Settings
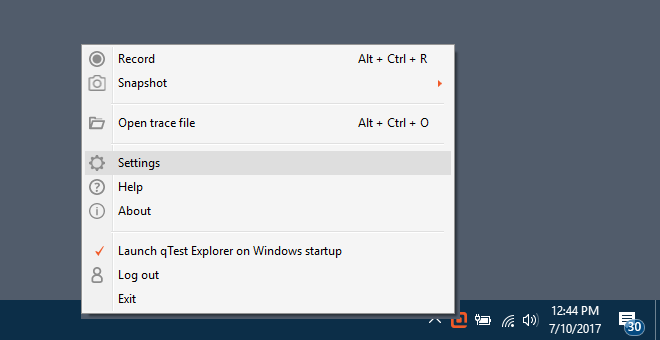
Add new connection and select defect tracker.
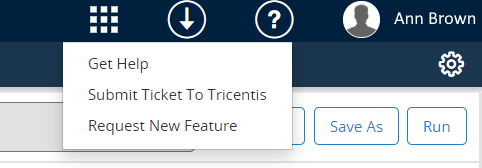
Have Questions?
The best way to receive help is to submit a ticket through your qTest instance. Click the Help icon, and then click Submit Ticket to Tricentis to access the Tricentis Support portal, where you can create an incident. You can also click Get Help to access the qTest manual, which contains information that may answer your question.