View qTest Test Execution Data in Jira
You can view qTest test execution data within a linked Jira issue using the Jira Integration: qTest Enterprise add-on. This add-on allows you to clearly visualize all Test Cases and Test Runs associated with Jira issues, along with their test execution statuses, in real-time, helping you easily manage your test execution data in a single location. Using this add-on, you can also:
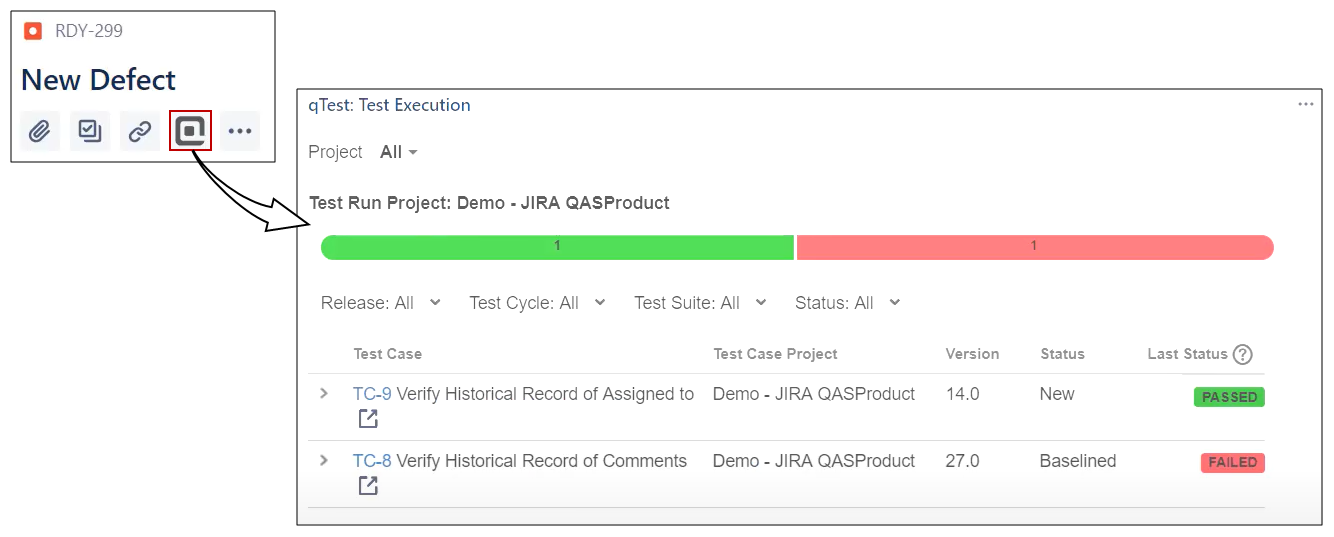
For instructions on installing the Jira Integration: qTest Enterprise add-on, refer to the installation instructions on Atlassian Marketplace. Once the add-on is installed, access it by clicking the qTest icon or by navigating to the qTest: Test Execution section of a Jira issue. This section includes several filters, a status bar chart, and a list of Test Cases associated with the issue. Test Cases display the five most recently executed Test Runs by executed end date.
View Test Runs for a Jira issue by status
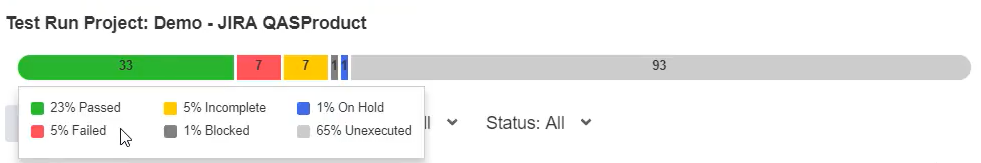
The status bar chart in the qTest: Test Execution iframe displays the number of all related Test Runs for an issue by status, allowing you to easily determine the testing progress of an issue at a glance. Hover your cursor over the bar chart to display a color legend that indicates the percentage of Test Runs that are in each status. The bar chart displays several standard statuses as well as any custom statuses that have been created.
Filter test execution data for a Jira issue
The qTest: Test Execution iframe includes several filters that can be used to quickly display only certain types of Test Runs. For example, you can use the filters to display a list of only Test Runs that have failed for the current release.
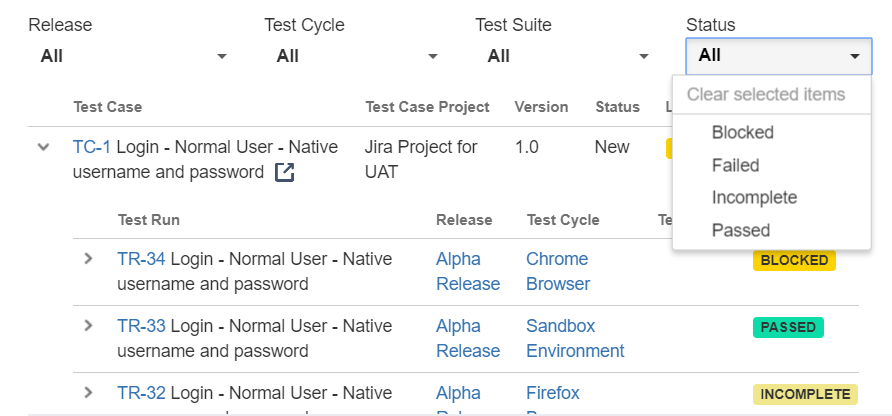
To apply a filter, click a filter to display a drop-down menu, where you can select a filter value. When you select a value, the Test Case grid automatically refreshes to apply the selected value. You can use multiple filters and select multiple values at one time. For example, you can select two releases in the Release filter and three statuses in the Status filter to display only Test Cases that belong to either release and are in one of the three statuses.
Automatically filter Test Runs by fix version or sprint for Jira issues
You can configure your Jira integration settings in qTest Manager to automatically filter only Test Runs in the qTest: Test Execution iframe that match the fix version or sprint of a Jira issue. For example, if a Jira issue is associated with sprint 20 and the automatic filter is enabled, then only Test Runs that are executed in sprint 20 are displayed in the qTest: Test Execution iframe on the issue.
To enable the automated filter:
-
Access qTest Manager.
-
Click the Gear icon
 . Then select Integration Settings.
 -
In the External Systems panel, select JIRA.
The Configure Integration: JIRA screen appears.
-
In the Connection List section, hover your cursor in the Actions column for the Jira connection you want to configure.
-
Click the Configure icon
 .
.The Configure Connection screen appears.
-
In the Release Integration section, select the Auto-filter Test Runs on Jira iframe to match Fix Version/Sprint of Jira issue check box.
-
Click Save.