Sample Scenario BDD Workflow
Below is a sample Behavior Driven Development (BDD) workflow, for customers using qTest Scenario with an active license to the qTest platform. This workflow provides an overview of how each integration works together to create a seamless transition for Behavior Driven Development (BDD) in a continuous integration environment.
We use the following tools during this process:
-
Jira Software: Issue creation such as User Stories, Epics, Tasks, etc.
-
qTest Scenario-BDD for Jira: Add-on for Jira Software for feature and scenario creation.
-
qTest Pulse: Facilitates event-based rules for BDD workflows.
-
Supported Git Repository: Stores feature files created in qTest Scenario as a source of truth.
-
Jenkins: Continuous integration tool that monitors source code commits.
-
qTest Manager: Contains execution results of scenarios for additional reporting.
-
qTest Insights (optional): Enterprise reporting of test scenario status.
Prerequisites
The following prerequisites are required before you can begin using the sample workflow as described.
-
-
Integrate with a supported Git Repository
-
-
Please read the How to Use Scenario in Jira for step-by-step instructions on how the Scenario add-on functions inside of Jira.
Starting Behavior Driven Development
Create a New Feature in Jira
-
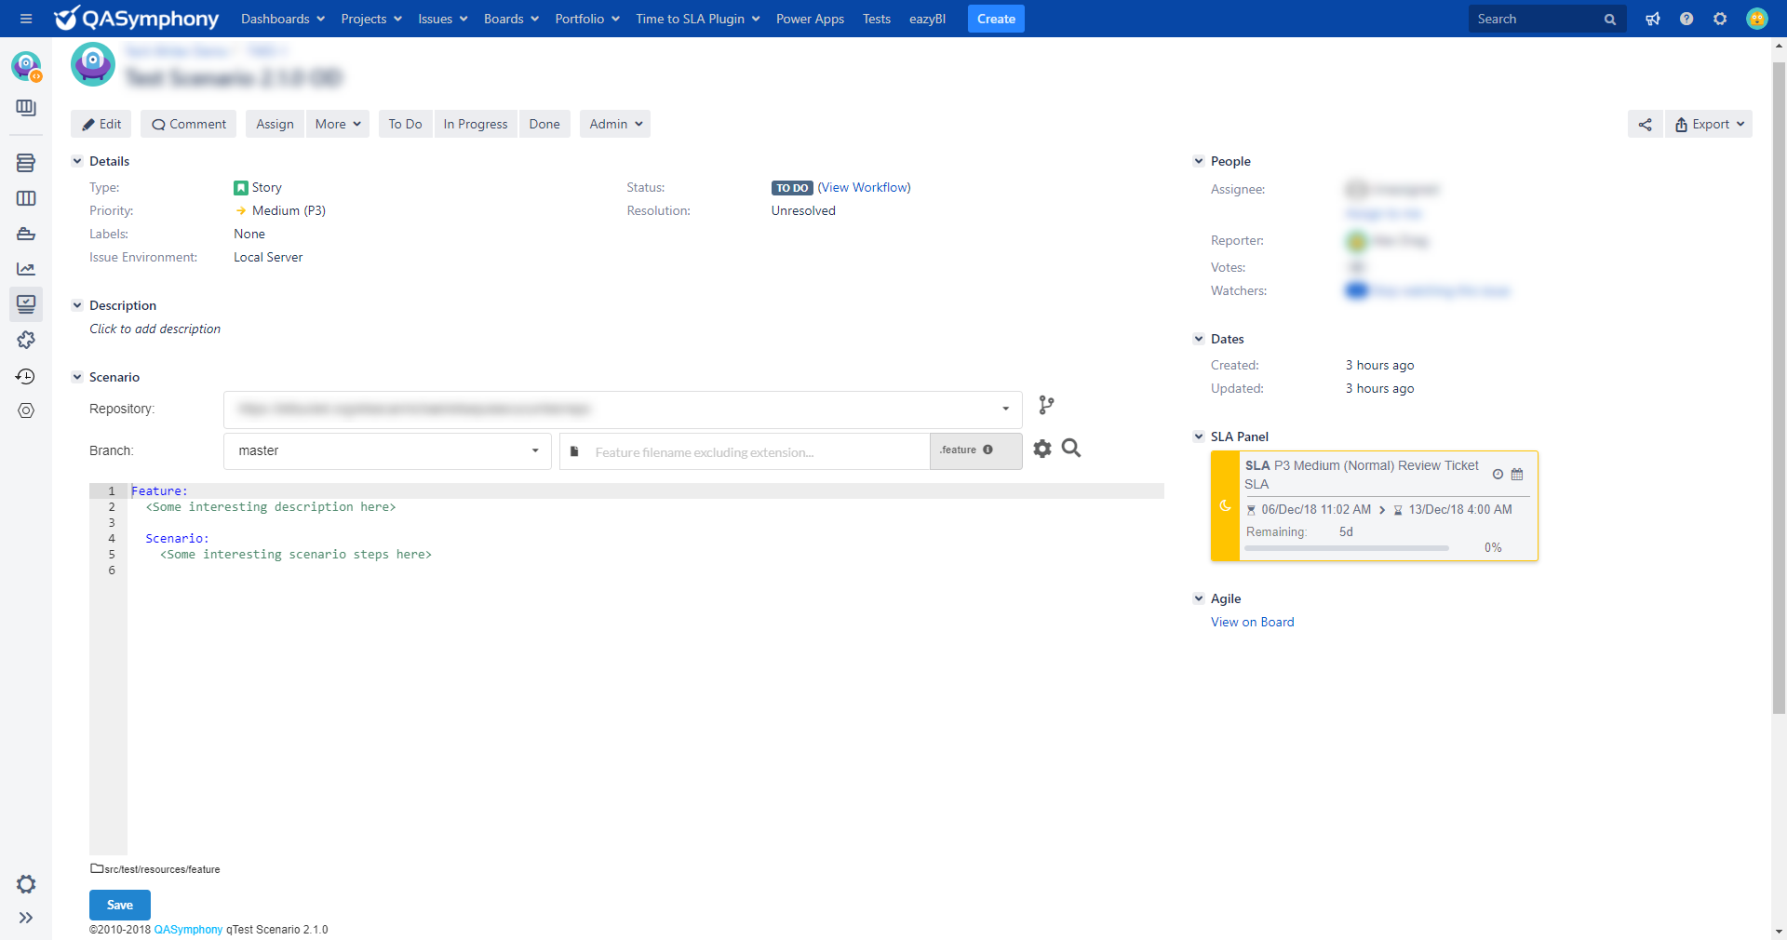
Enter a new Issue in Jira and select the Scenario add-on located at the bottom of the Jira issue.
-
The information entered in the Feature field is essentially the Acceptance Criteria for the new Feature (User Story) which will be determined by the Developer, Product Owner/BA, and Test Engineer.
What you enter in the Feature section of the Scenario plug-in, will become the file name that will create a Feature File in your Git Repository. If the feature name directory already exists, qTest Scenario will notify the user upon saving. This helps limit the mistake of overwriting existing feature files in your VCS. -
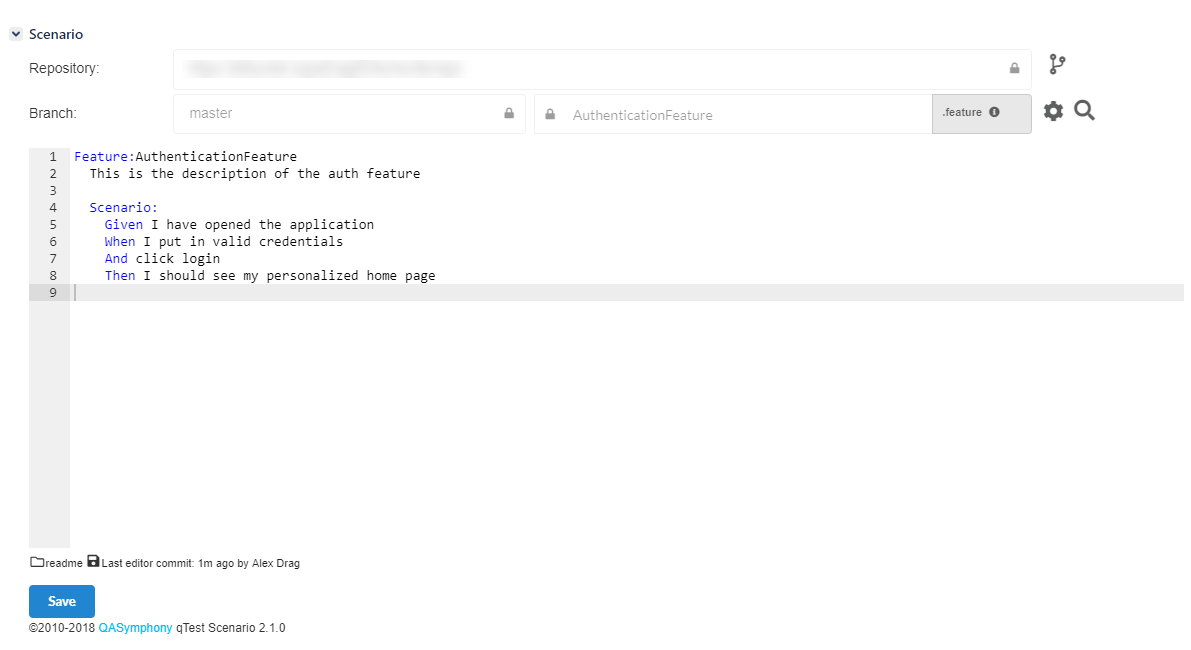
Once you enter the Feature information, you will begin placing your testing scenarios in the Scenario field. You will use the Gherkin syntax of "Given, When, Then, etc." through Cucumber integration. You can have multiple scenarios for one Feature, just as you would have multiple test cases for one user story.
-
Now that the Feature and Scenario are decided upon by the development team, you will save. This will save the Feature File directly in Bitbucket or GitHub, depending on your configuration.
When you save the Feature File, any changes you make in the source code will sync to Jira in real-time. Therefore, if a developer or tester needs to edit the source code, the PO/BA will be able to see the updates in Jira for greater visibility.
Adding in Test Driven Development
Fail the Feature File to Start the Automation Process
Now that you have agreed on how you will develop the new Feature, Test Driven Development (TDD) can begin by failing the Feature File so that Automated Code Coverage can start.
-
The Test Engineer will generate an automated code stub that will send failing step definitions in the Git Repository.
-
The Trigger Jenkins Pulse Rule notifies the Developer by kicking off a Jenkins Build and taking those results and sending them to Jira.
-
The Color Code Scenario Results in Jira Pulse Rule provides a visual indicator that the Scenario results are returned and have failed. This allows the PO/BA, Test Engineer, and Developer to view the latest Execution results from Jira.
-
Now, you will implement the feature and add automated step definitions to move this feature into production.
-
Using your IDE or directly working in your Git repository, you will need to refactor your code to make the feature and scenarios pass.
-
Commit and push your code so that Jenkins can create a Build and validate that the test scenarios have passed. The TriggerJenkins rule will kickoff again notifying.
Implement Feature and Add Step Definitions
Next, you will need to implement the feature and add automated step definitions using Selenium with Cucumber. These actions will move this feature into production.
-
Using your IDE or directly working in your Git repository, refactor your code to make the Feature and Scenarios pass. The Automation Code (<code>) has to be written within each Step Definition Block and can be supported by a Selenium library to handle browser UI automation.
-
Commit and push the code for Jenkins to build and validate that the test scenarios have passed. A developer will be able to see the versioned tests in your Git Repository.
-
View the results in Jenkins and validate in Jira that the Scenario results have turned green (color coding Pulse rule).
-
Move the Jira issue into a Done status.
Report Scenario Results
View Results in qTest Manager
The Link and Report Scenario Results in qTest Manager Pulse Rule allows you to link Scenario requirements to qTest Manager so you can report and view test progress in BDD along with other projects not using a BDD methodology.
-
On the Test Execution tab in qTest Manager, navigate to the Test Cycle or Test Suite that you configured in the Pulse Rule.
-
In the Test Run grid, click a Test Run ID link in the ID column to display the Test Run page.
-
Click the Execution History tab to view the latest test scenario results along with previous test scenario logs.
Create Additional Charts with qTest Insights
View Execution Results
-
Navigate to qTest Insights from the Product Navigator.
-
From the Analysis drop-down, select Quality.
-
Select the Global Filter icon and choose the Project name that you used for this workflow.
-
Select the Refresh Now icon to view the results in your Quality dashboard.
-
You can also save the report or Embed the Script to share the report on another website.
View Coverage Results
-
Navigate to qTest Insights from the Product Navigator.
-
From the Analysis drop-down, select Coverage.
-
Select the Global Filter icon and choose the Project name that you used for this workflow. (This filter selection will auto-save from the Quality dashboard above or your last log in.)
-
Select the Refresh Now icon to view the results in your Coverage dashboard. (Optional, if you are loading the Coverage dashboard from the previous criteria selected in the Quality dashboard above.)
-
You can also save the report or Embed the Script to share the report on another website.