Monitor the execution of TestEvents and ExecutionLists
Once you press Execute Now, Tosca Commander transfers your TestEvents to the Tosca Distribution Server. Use the Distributed Execution Monitor to monitor the execution of these TestEvents and the ExecutionLists that they contain.
Monitor TestEvents
To view the current status of your TestEvents on the server, open the Distributed Execution Monitor and navigate to the Event View.
The Event View contains the following information:
-
A status bar with summary information on the status of your TestEvents.
-
Columns with detailed information on the last 10 TestEvents.
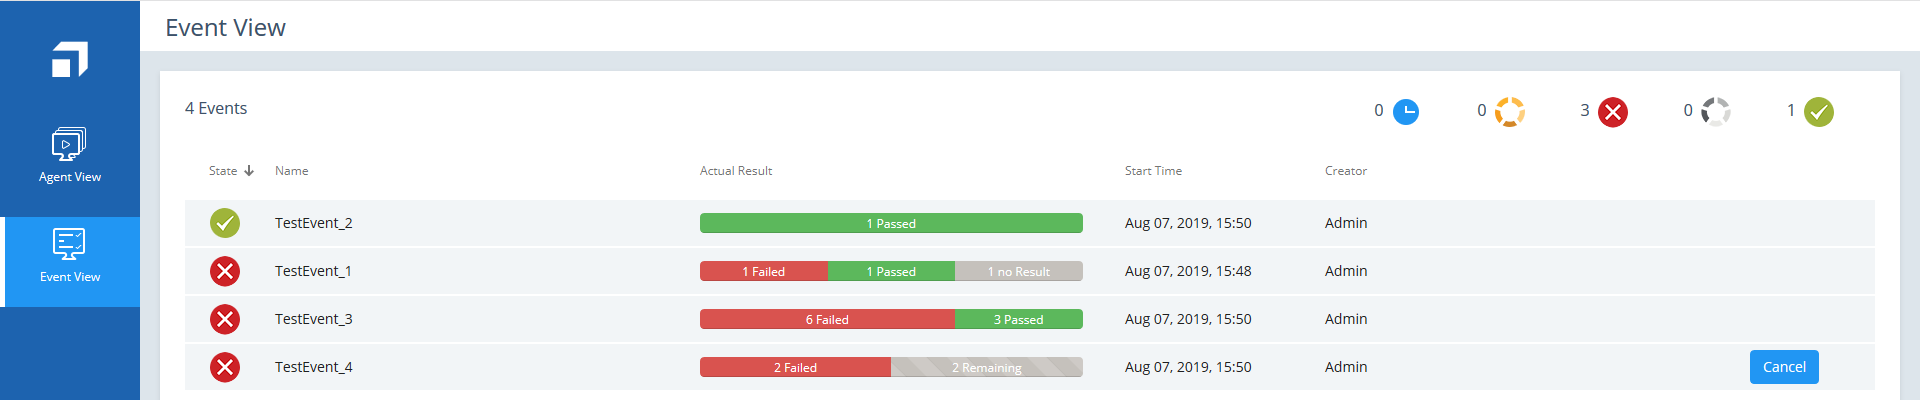
Event View of the Distributed Execution Monitor
The status bar indicates the total number of TestEvents that you have forwarded to be executed as well as the status of these TestEvents:

Title bar of the Distributed Execution Monitor
The table below lists the icons that illustrate the status of a Test Event in the Distributed Execution Monitor.
|
Icon |
Description |
|---|---|
|
|
Planned TestEvents (Queued) |
|
|
Currently running TestEvents (Running) |
|
|
An error has occurred (Error) To learn more about the error, click on the icon or check the log file of the agent. |
|
|
Canceled TestEvents |
|
|
Executed TestEvents (Finished) |
The columns below the status bar provide you with detailed information on the last 10 TestEvents.
|
Column |
Description |
|---|---|
|
State |
State of the TestEvent |
|
Name |
Name of the TestEvent |
|
Actual Result |
Execution state of the ExecutionLists of the TestEvent (Passed, Failed, Remaining) |
|
Start Time |
Time the TestEvent was forwarded to the server |
|
Creator |
User who started the TestEvent |
If your TestEvents get queued even though you have idle Distribution Agents available, view your ExecutionLists as described in chapter "Monitor ExecutionLists".
Monitor ExecutionLists
To view the current status of the ExecutionLists within a TestEvent, follow the steps below:
-
Open the Distributed Execution Monitor and go to the Event View.
-
Click on the respective TestEvent that contains the ExecutionList you want to check.
The TestEvent window opens and displays the following information:
-
a header showing the TestEvent owner (i.e. the user who started the TestEvent), the TestEvent status, and the duration of the event (i.e. the time spent executing the ExecutionLists within the TestEvent so far)
-
a status bar with summary information on the execution status of the ExecutionLists
-
columns with detailed information on every ExecutionList
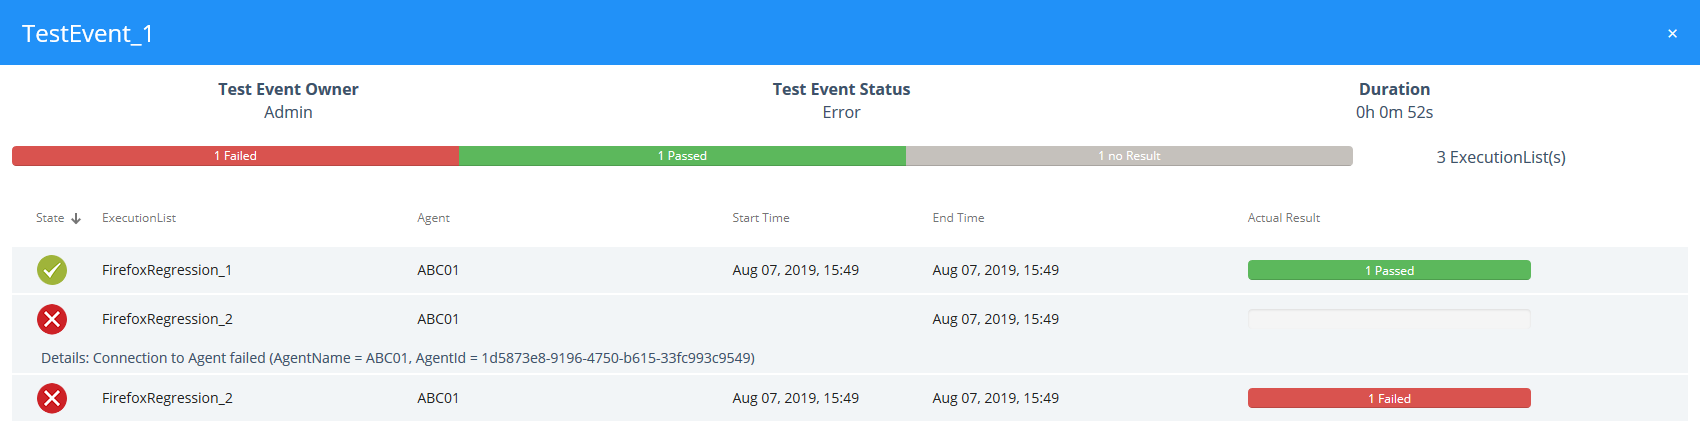
Detailed information about a TestEvent
The columns below the status bar display the following information:
|
Column |
Description |
|---|---|
|
State |
State of the ExecutionList |
|
ExecutionLists |
Name of the ExecutionList |
|
Agent |
Tosca Distribution Agent that runs the ExecutionList |
|
Start Time |
Point in time when the ExecutionList started running |
|
End Time |
Point in time when the ExecutionList finished running |
|
Actual Result |
Results of the ExecutionEntries within an ExecutionList |
The Tosca Distribution Server queues TestEvents if there are no Tosca Distribution Agents available that match the configuration you assigned to the TestEvent.
The Distributed Execution Monitor displays this information underneath the respective ExecutionList:

Queued ExecutionList