Create trend charts out of execution results
Tosca Commander allows you to generate graphical representations of test results. You can display the results of your ExecutionList folders
To enable trend charts, go to Project->Options->View and activate the Enable trend charts checkbox.
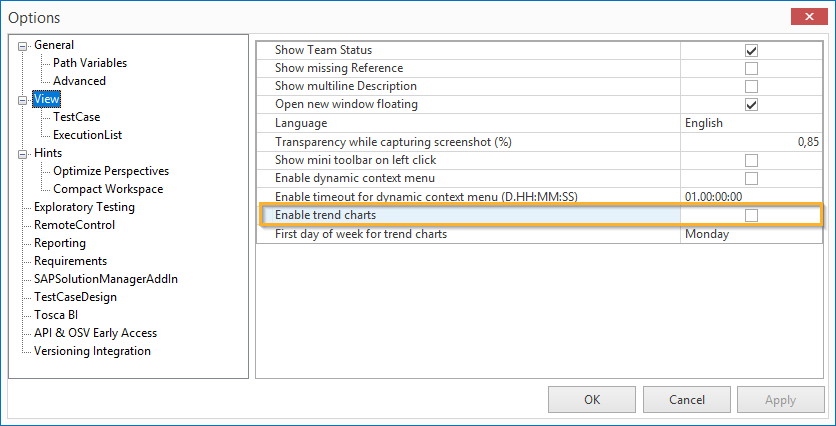
Tosca Commander Options: Enable trend charts
Tosca Commander adds a Trend chart tab to the Execution section for ExecutionList folders and ExecutionLists

|
If you enable trend charts, you may encounter longer wait times. |
The example below visualizes execution results in a StackedBar trend chart.
-
The Y-axis indicates that you executed 6 TestCases.
-
The X-axis displays the execution results in the specified time interval, in this case hourly.
-
The tooltip contains summary information on the execution run at 14:00:00.
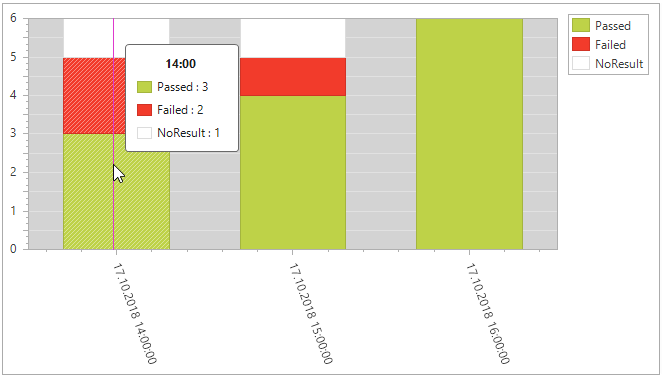
Example of a StackedBarchart: Execution results displayed in hourly intervals
You can zoom in and out of trend charts by using the scroll wheel of your mouse.
Configure trend charts
You can configure your trend chart in the menu bar to the right of the chart:
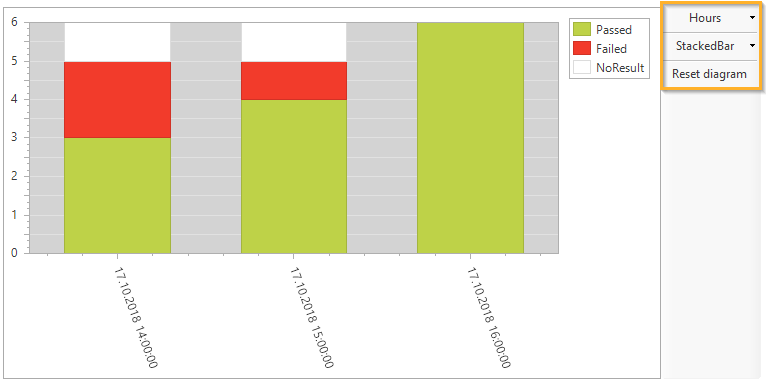
Menu bar to the right of the trend chart.
Use the menu bar to perform the following actions:
-
change the time interval
-
change the chart type
-
restore the default view of your chart by clicking Reset diagram
Change the time interval
To change the time interval, select the desired interval from the dropdown menu.
You can specify one of the following intervals:
|
Time interval |
Display format |
|---|---|
|
Hours |
dd.MM.yyyy HH:mm:ss |
|
Days |
dd.MM.yyyy |
|
Weeks |
<calendar week> (<year>) |
|
Months |
<name of the Month> |
|
Years |
<Year> |
Change the chart type
By default, Tosca Commander visualizes execution results in a StackedBar chart.
To change the chart type, select the desired chart type from the dropdown menu.
If you choose a 3D chart type, you can rotate it by moving the mouse while keeping the left mouse button pressed. The tooltip feature is not available for 3D charts.