Create Dashboard Report Actions
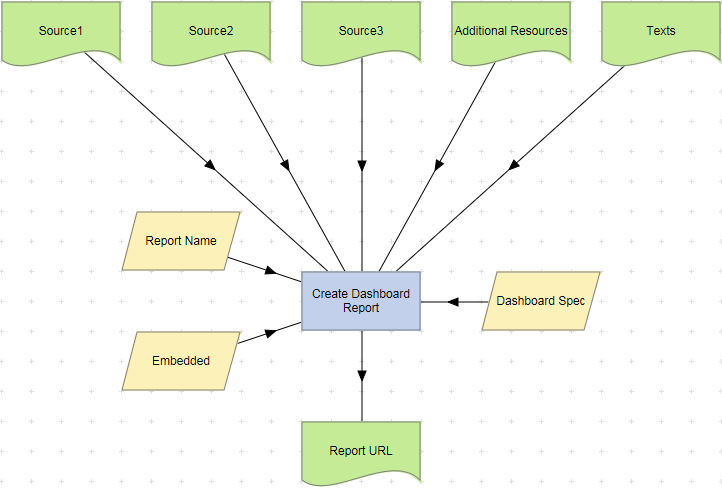
Create Dashboard Report actions produce a graphical report based on the contents of one or more Table datasets. Each Table dataset is represented as a graph or chart, and each graph or chart may be selected in the report in order to display the associated table. The layout of a Dashboard report and the type and format of each chart that is displayed is determined by an XML parameter that references the Source datasets to be reported upon.
Each report generated by the action is stored in a folder underneath the LiveCompare user data directory. If the Create Dashboard Report action’s Fixed parameter is set to ‘false’, its reports are stored in the following time-stamped directory:
<LiveCompare user data dir>\public\Reports\<Workspace Name>\<Report Name>_YYYYMMDD_HHMMSS
If the Create Dashboard Report’s Fixed parameter is set to ‘true’, its reports are stored in the following directory, which does not include a time stamp:
<LiveCompare user data dir>\public\Reports\<Workspace Name>\<Report Name>
| Action Property | Description |
|---|---|
| Additional Resources |
A Table dataset that associates each graph or chart in the Dashboard report with an additional URL, for example the URL for a more detailed report generated from the graph or chart’s Table dataset. The table should have two columns. Values in the NAME column should refer to the names of the reports. Values in the second column should refer to the additional URLs. The report names are displayed in the ‘Additional Resources’ section of the Dashboard report as links to the appropriate URLs. The Additional Resources section of a Dashboard report includes a link to an Excel report named ‘Analysis Input Data’. This report contains a copy of the input parameters passed to the Create Dashboard Report action. The value of each input parameter is stored in a separate worksheet, which is named after the parameter whose value it contains. By specifying the ‘StringsToTwoColumnTable’ conversion type, the Convert Data action may be used to create an Additional Resources Table dataset from one or more report URLs. |
| Dashboard Spec | An XML parameter or dataset which specifies the layout of report, the type and format of each chart and the Source datasets to be reported upon. |
| Data Store (optional) | A Data Store parameter or dataset referring to a Data Store containing tables that will be viable to the Create Dashboard Report action. These tables may be used as ‘Param’ values in a Dashboard specification. |
| Embedded | If this Boolean parameter is set to ‘true’, the Dashboard report’s header and footer will not be displayed. The default value is ‘false’, which means that the report’s header and footer will be displayed. |
| Fixed |
A Boolean parameter which indicates whether the Create Dashboard Report action will generate fixed location reports. If this parameter is set to ‘true’, the action stores its report in the <Report Name> directory; this directory will be removed and then recreated each time the action is run. If the Fixed parameter is set to ‘false’, a new report will be generated in its own time-stamped directory each time the action is run. Each fixed location report in a workspace should normally have a different value for its Report Name parameter. This will ensure that each workflow’s Report URL dataset points to the expected report. |
| Report Name | A String parameter which stores the name used for the generated report. If the Fixed parameter is set to ‘false’, the generated report name includes a timestamp indicating when the report was created. |
| Report URL | A String dataset which is set to contain the URL of the generated report. |
| Source1 | A Table dataset containing data to be written to the Dashboard report. |
| Source2 | A second Table dataset containing data to be written to the Dashboard report. |
| Source3 | A third Table dataset containing data to be written to the Dashboard report. |
| Subchart1 (optional) | A String dataset containing a report URL that normally refers to a lower level Dashboard report, although it may refer to other types of report. The lower level report may be opened from the main report by clicking the appropriate chart area. The association between chart areas and subcharts is determined by the order of the entries within the Dashboard specification’s <SUBCHARTS> tag. |
| Subchart2 (optional) | A String dataset containing a report URL that normally refers to a lower level Dashboard report, although it may refer to other types of report. The lower level report may be opened from the main report by clicking the appropriate chart area. The association between chart areas and subcharts is determined by the order of the entries within the Dashboard specification’s <SUBCHARTS> tag. |
| Subchart3 (optional) | A String dataset containing a report URL that normally refers to a lower level Dashboard report, although it may refer to other types of report. The lower level report may be opened from the main report by clicking the appropriate chart area. The association between chart areas and subcharts is determined by the order of the entries within the Dashboard specification’s <SUBCHARTS> tag. |
| Texts (optional) | A Table parameter or dataset with TITLE, VALUE and SUBTITLE columns containing text elements to be substituted into the Dashboard report. Rows in the Texts table may be referenced in a Dashboard specification using <OBJECT> tags. See these examples. |
Creating a Default Dashboard Specification
To create a default Dashboard specification, specify table parameters for the Create Dashboard Report action’s Source datasets as required, and then choose ‘Create Default Dashboard Spec’ from the action node’s context menu. An XML parameter named ‘Dashboard Spec’ is created, which displays a pie chart for each of the action’s Source properties that is linked to a Table dataset.
Note that each Source table should only be used as input for a single Create Dashboard Report action. If you wish to generate more than one Dashboard report for a Source table, each with a different Dashboard specification, use the Convert Data action’s InTable and OutTable properties to create copies of the Source table.
Generated Dashboard reports may be accessed by double-clicking the action’s Report URL dataset, or by choosing ‘View Details’ from the dataset’s context menu. They may also be accessed from a workspace’s Reports folder in the LiveCompare hierarchy. Choose ‘Reload Children’ from the folder’s context menu to list any newly-generated reports.
Example:
To examine the details for a Create Dashboard Report action, double-click the action node, or select ‘View Details’ from the node’s context menu. The Details screen displays the number of records in each of the Source tables and the time taken for the action to complete.
Create Dashboard Report actions support the use of the Define Action Parameters Wizard, which allows new ‘Source’ input parameters to be created with the type ‘Table’, and new ‘Subchart’ input parameters to be created with the type ‘String’. String input parameters set to Dashboard report URLs may also be used as ‘Param’ values in a Dashboard specification’s OBJECT_LINK tags.
Creating Dashboard Specifications