How to Build your Dashboard
The Dashboards feature allows you to consolidate and arrange metrics on a single screen, while also providing you with a broad view of a variety of information at once. 'Dashboard Panels' are charts, graphs, grids and other reporting widgets that you can add to shared and personal dashboards.
In this article, we explain how you can Build and manage your own Dashboard. If you are using a version of Insights released prior to 1.16, please refer to this article for information on Dashboards.
How to Get Here
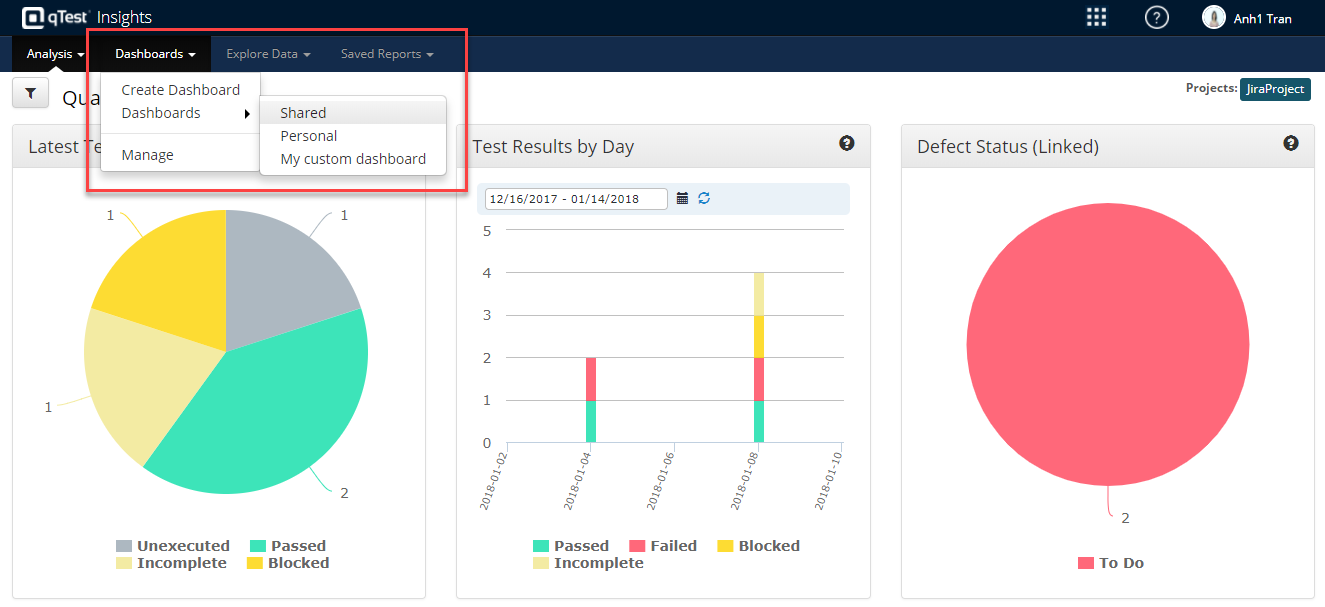
From the Dashboards drop-down, hover over the Dashboards menu option and select either Shared, Personal, or any custom dashboard.
For information on how to create a new dashboard, read this article.
Understand the Dashboard
To use the Insights Dashboard and view data, you will need to add 'Panels' to your Dashboard. Panels are charts, graphs, grids and other reporting widgets. There are pre-built Panels, or you can create custom Panels.
Dashboard Gallery
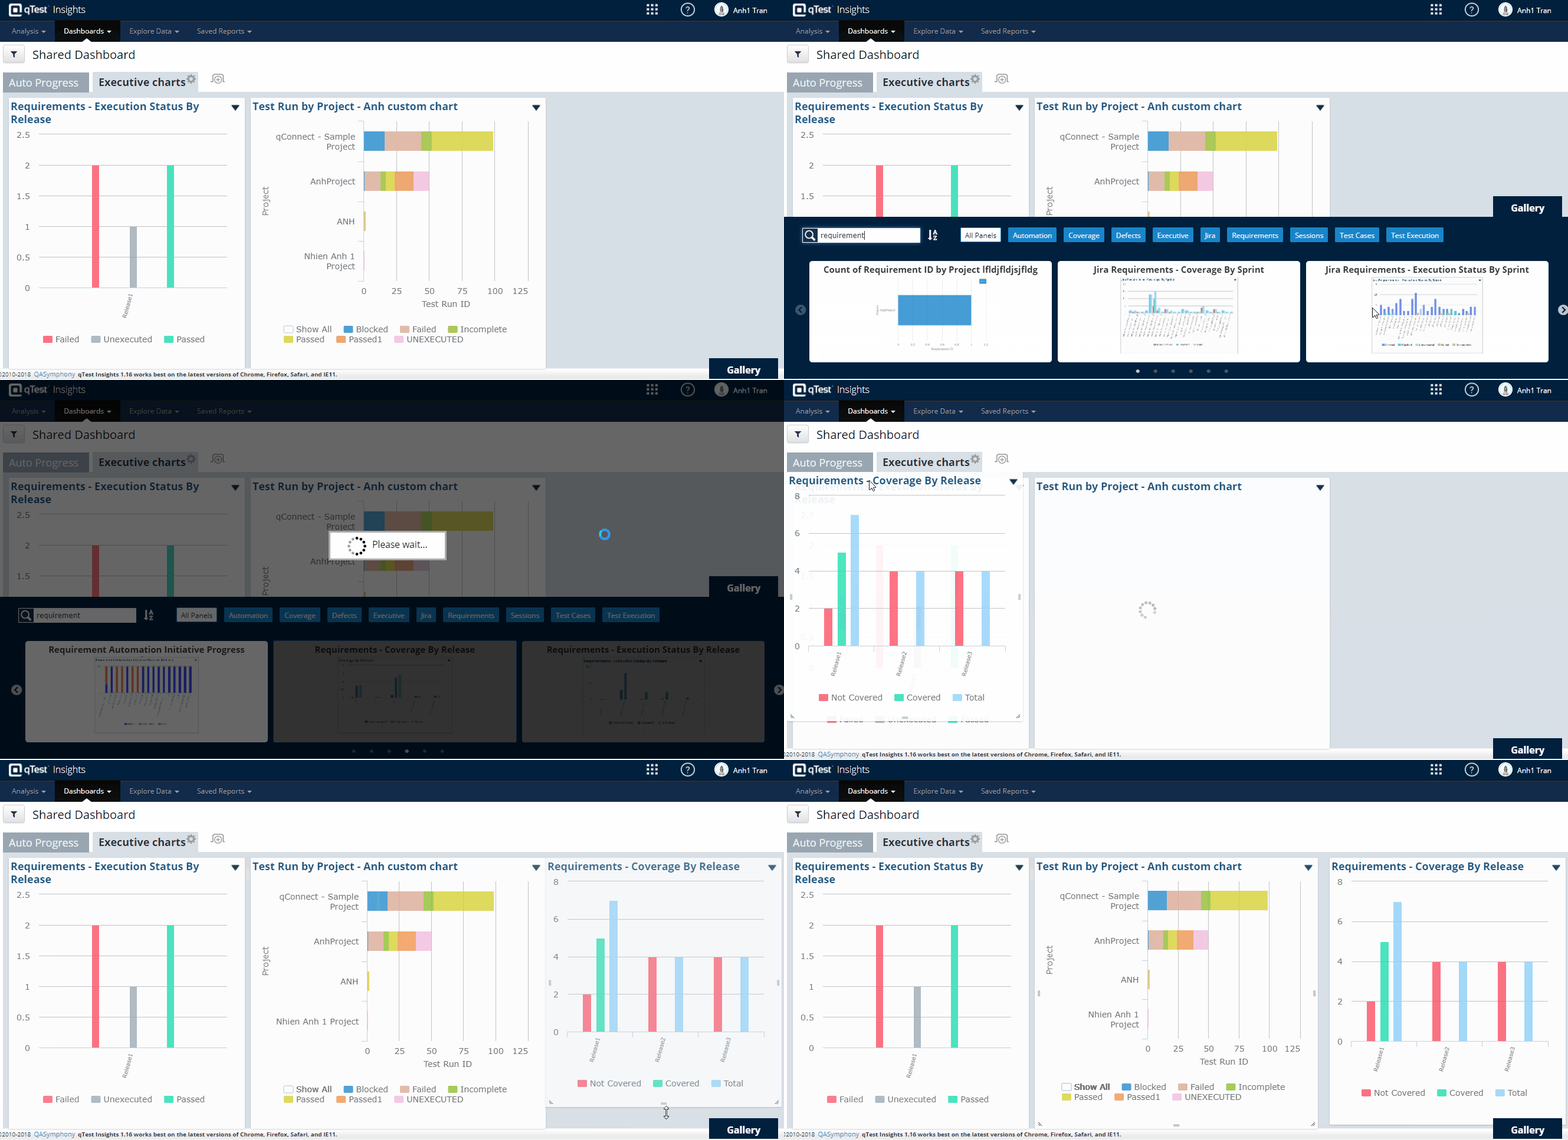
Open the Dashboard Gallery for easy viewing of the chart panels, which displays as a carousel at the bottom of the Dashboard screen. You can collapse/expand the Dashboard Gallery by selecting the Gallery tab.
Panel Categories
All pre-built panels are arranged into categories. There are 9 categories, some charts will be available in multiple categories.
-
Automation
-
Coverage
-
Defects
-
Executive
-
Jira
-
Requirements
-
Sessions
-
Test Cases
-
Test Execution
Drag/Drop Panels
You have the ability to drag/drop panels from the carousel onto any dashboard (except the saved-with-filter dashboards, because the saved-with-filter dashboard is an uneditable saved version of its original dashboard.) Once a panel has been added to a dashboard, the panel will then be grayed out in the carousel as a visual indicator that the panel is applied to the displayed dashboard.
Search Panels
You can search for panels by selecting 'All Panels' or by selecting the individual category name. The search field uses predictive text and will begin loading applicable panels.

Sort Panels
You have the option to sort the displayed panels by A-Z, Z-A, and most recent (using the ![]() most recent icon.) Select the icon to the right of the search field to change the sort display.
most recent icon.) Select the icon to the right of the search field to change the sort display.
Custom Built Panels
You can Build a custom report, and create a new custom panel based on that report. To Build a custom report, refer to the Explore Data and Custom Reporting article.
A custom report that a user builds via Explore Data Reports and adds to a dashboard will automatically be included in the following categories:
-
Defects- Custom charts from Explore Defects (either qTest or linked)
-
Test Execution- Custom charts from Explore Test Run, Test Run Logs, Manager Combined
-
Requirements- Custom charts from Explore Requirements
-
Test Cases- Custom charts from Explore Test Cases
-
Sessions- Custom charts from Explore Sessions. Screens
Arrange Dashboard Layout
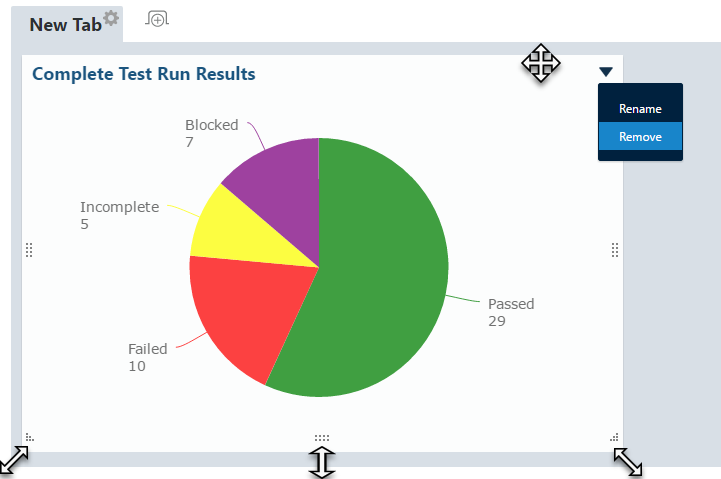
You can customize the dashboard layout by rearranging, adding, removing, or renaming panels.
Select the drop-down arrow icon to produce the rename and remove options.
Group Panels in Tabs
Collections of panels can be arranged in tabs within the dashboard. Select the gear icon to rename the tab, remove it from the dashboard, or change the layout.
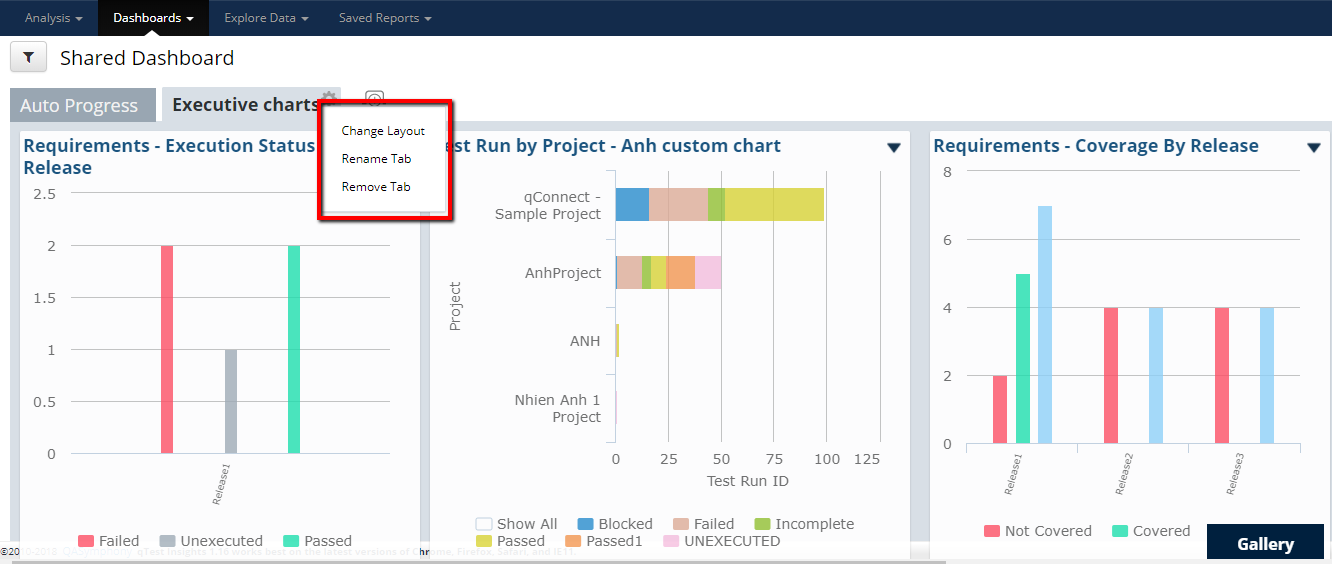
Change Layout
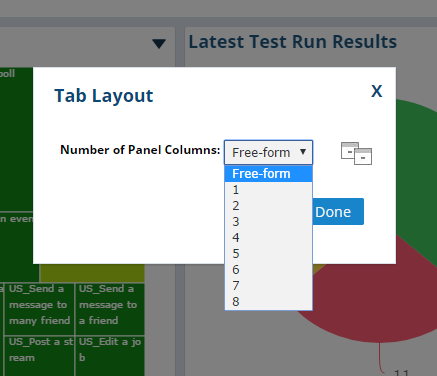
Select Change Layout from the configure options of the tab. In the tab layout popup, you can choose how to layout the dashboard panels.
-
Free-form: your selected panels will be displayed overlapping each other, then you can freely drag & drop, resize the panels.
-
Pre-defined Layout: quickly choose the number of columns and they will be arranged accordingly.
