Open the Distributed Execution Monitor
You can open the Distributed Execution Monitor in one of the following ways:
-
Enter the address of the Distributed Execution Monitor in your browser window
-
Open the Distributed Execution Monitor via Tosca Commander
Open the Distributed Execution Monitor in your browser window
To access the Distributed Execution Monitor in your browser window, follow the steps below:
-
Open your browser.
-
Enter the address http://<server IP address>:<port>/Monitor/ .
Replace <server address> and <port> with the IP address and the port of the Tosca Distribution Server.
Open the Distributed Execution Monitor via Tosca Commander
To open the Distributed Execution Monitor via Tosca Commander, you first need to adapt your settings. You only have to do this once.
To adapt your settings, follow the steps below:
-
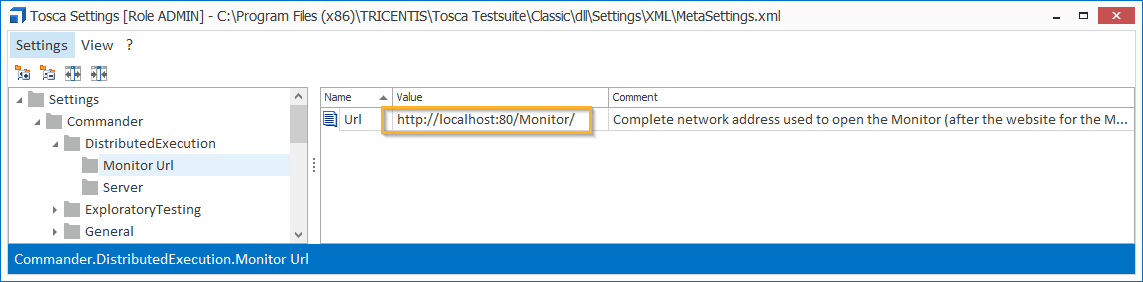
In Tosca Commander, navigate to Project->Settings->Commander->DistributedExecution->Monitor Url->Url.
-
Specify the address http://<server IP address>:<port>/Monitor/ .
Replace <server address> and <port> with the IP address and the port of the Tosca Distribution Server.
Modify the settings
To open the Distributed Execution Monitor via Tosca Commander, follow the steps below:
-
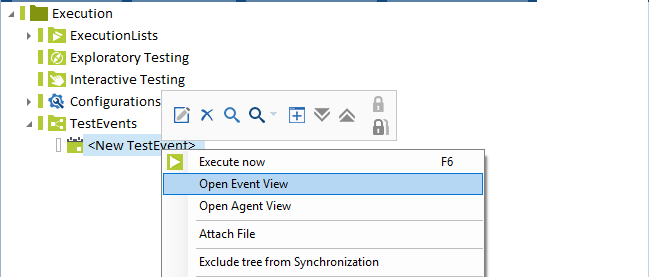
Right-click on a TestEvent.
-
Select Open Event View from the context menu to access the Event View of the Distributed Execution Monitor.
Select Open Agent View from the context menu to access the Agent View of the Distributed Execution Monitor.
Open Event View