Legacy Reports
Legacy reporting is available in the Reports module. Customers who are on the Elite plan should use qTest Insights for more reporting functionality.
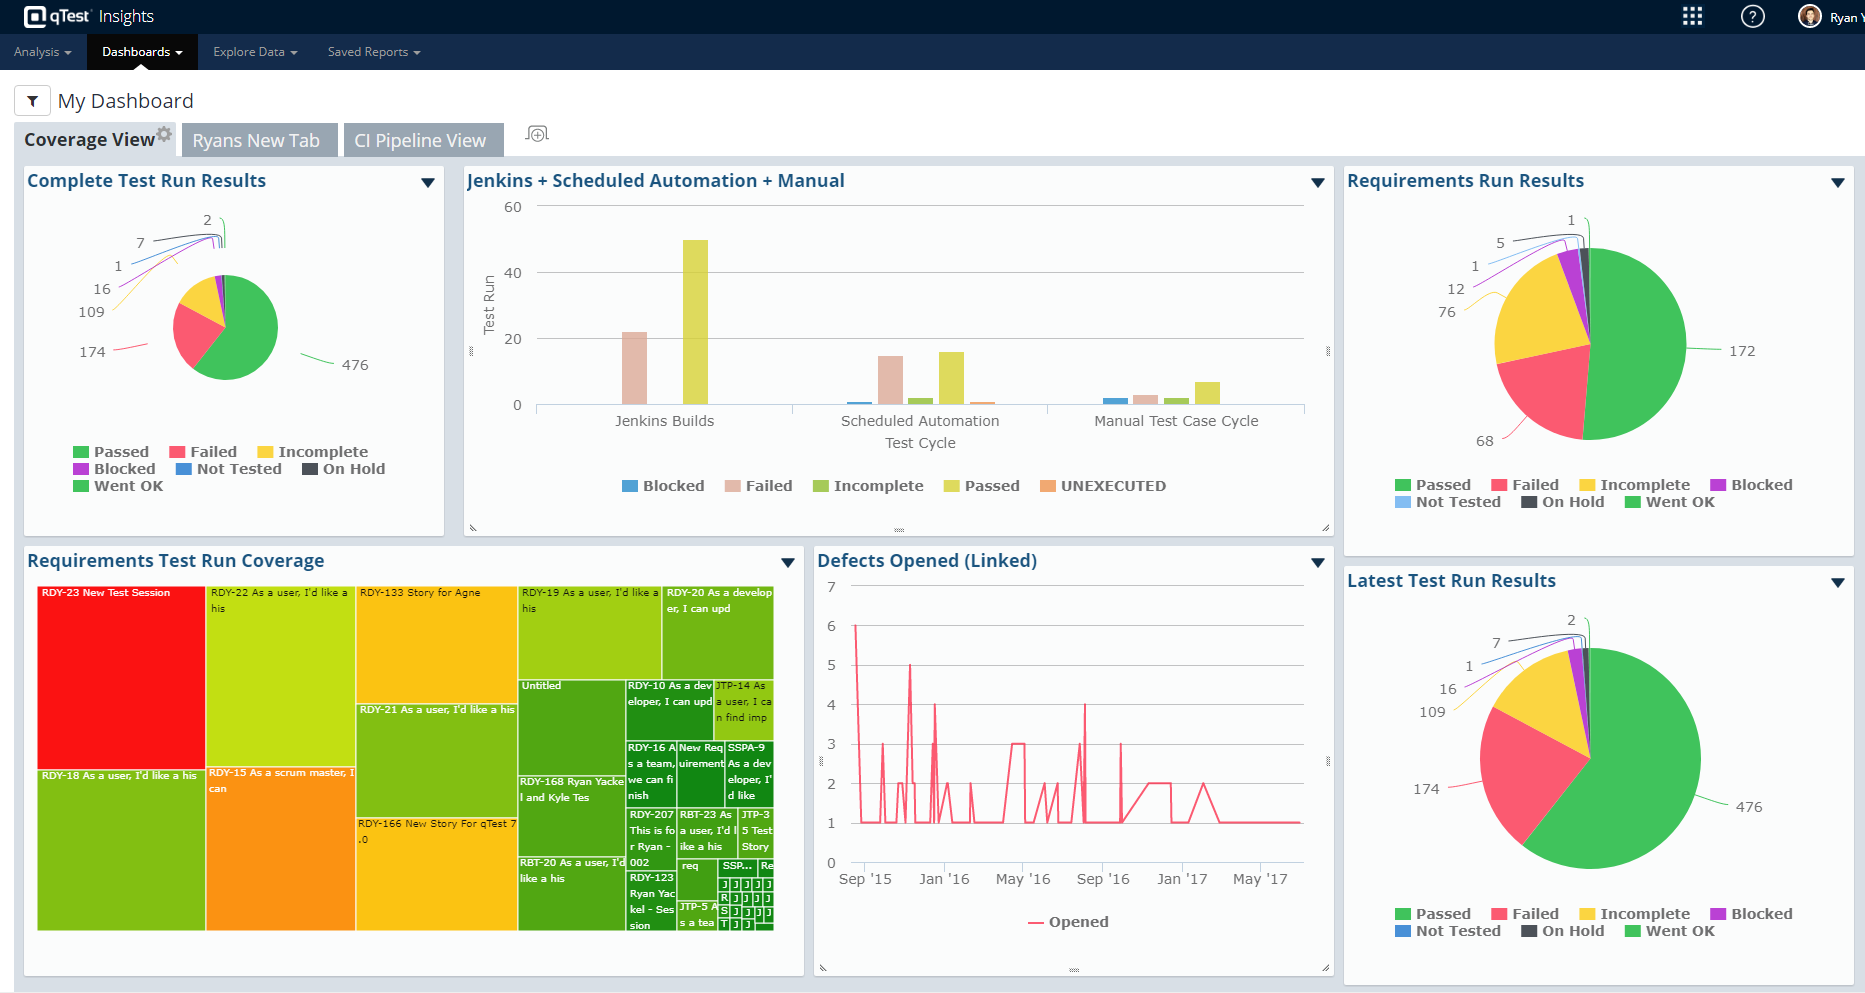
In addition to Insights and the legacy Reports module, you can also find export reports within other modules. For more details, refer to Export Requirements and Test Design Reports and Export Test Execution Reports.
Save Report Settings
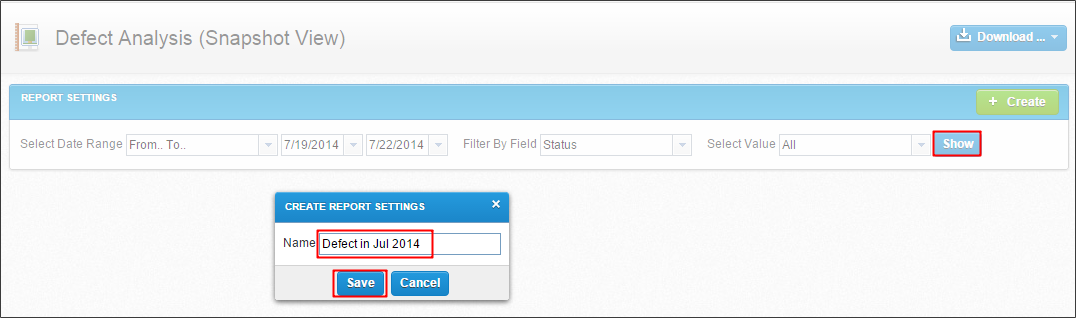
After you select all required filters, select the Create icon to save the settings. Input the Report Name. Saved settings are listed under the corresponding report on the left menu and are shared across the project team members for viewing.
Export Reports
You can export the Data Grids of these reports to an Excel file for further reporting purposes. The file can be exported to different formats such as XLS, PDF, and CVS. Select the Download icon to download the report.
Schedule Reports
To schedule reports, follow these steps:
-
Select the Schedule icon to open a pop-up window.
-
If you select the option Send to others, you will need to specify the recipients' emails. If recipients are not qTest Manager users, their email addresses must be listed in Mail Recipients Management by the Site Admin so they can receive the emails.
-
Start time: Specify when the email is sent to recipients. You can either select to send it right away or specify a future date and time.
-
Recurrence: Check if you want to make it a repeating event.
-
Repeats: Select if the event will repeat every day, week or month.
-
Repeat every ... days: Specify the interval (number of days) between two events in a same series. This can be weeks or months depending on your selection in the Repeats field.
-
Ends: Specify when the event will stop repeating, as follows.
Never: The event will not stop repeating.
After ... occurrences: The event will repeat x times before it stops.
On: Specify a date after which the event will stop.
-
Select OK to create the schedule.

Test Case Creation & Approval
This report provides an audit of Test Cases created and approved, filterable by Module. You can select a specific Module for the report to show the data. Only one option can be selected at a time. The "All" option is used to selected all modules, by default.

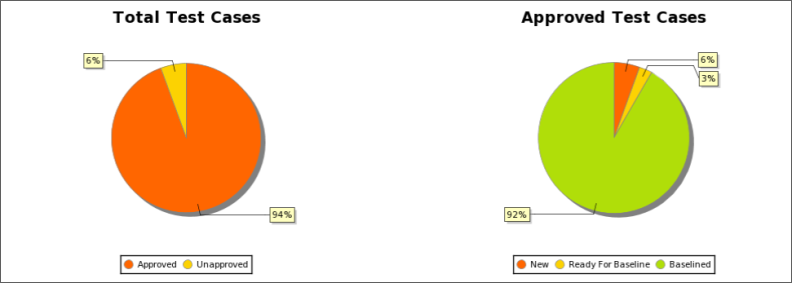
The Latest Informationsection shows the current quantity of Test Cases and how many are approved/unapproved.

The Charts and Legends section graphically displays the report's statistics. The graphs provide a quick view of the approved Test Cases in the system at the current time.
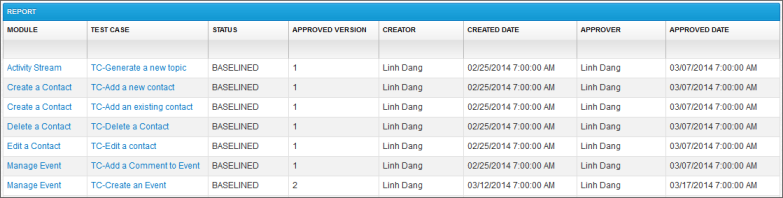
The Data Grid contains the detailed data of the approved Test Cases in the selected module. You can export the grid to an Excel file.
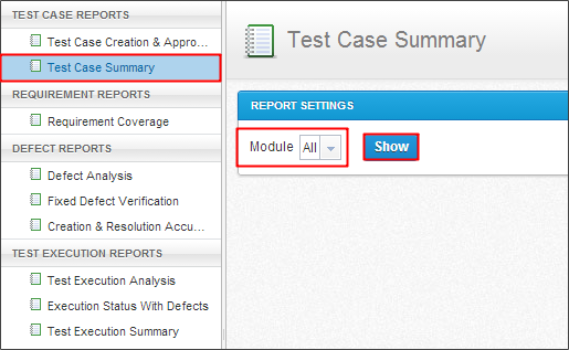
Test Case Summary
This report provides detailed data for all Test Cases at the report run time. You can select a specific module for the report. Only one option can be selected at a time. The "All" option is used to selected all modules, by default.
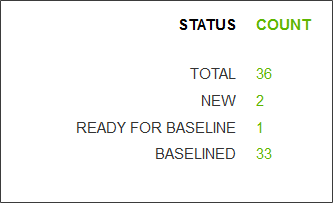
The Latest Information section shows the current quantity and percentage of Test Cases, grouped by their current statuses. The highlighted information provides an overview of the Test Cases in the selected module.
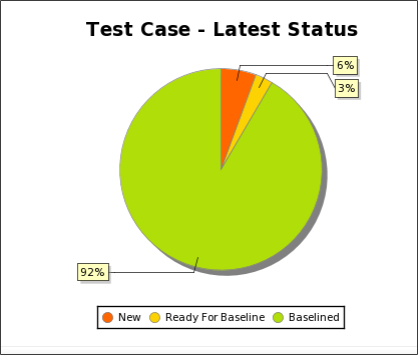
The Charts and Legends area shows the status of test cases in the selected module.
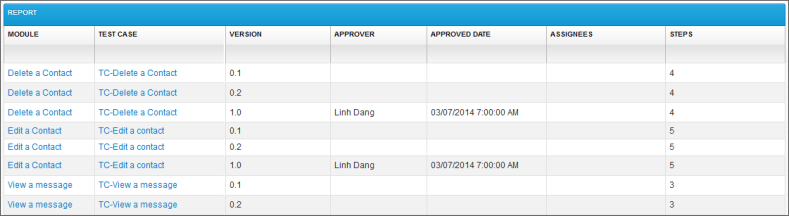
The Data Grids contains the detailed data of all Test Cases in the selected module. You can export the grid to an Excel file. The report can be exported to a different format such as PDF, CSV, or XLS by selecting the Download icon.
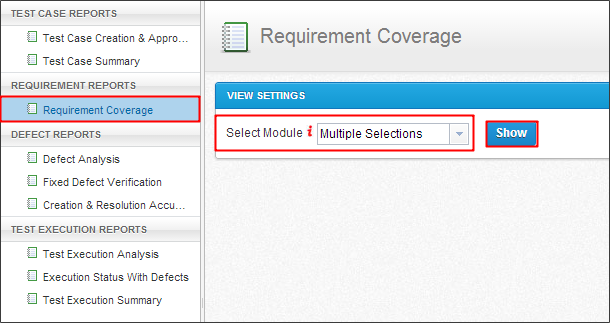
Requirement Coverage Report
This report lets you compare the total number of Requirements vs. the actual covered Requirements vs. the executed Requirements grouped by each module. A Requirement is fully covered when all Test Cases linked to it are already approved. Similarly, a Requirement is considered to be executed when all Test Cases linked to it have executed all Test Run instances. You can select up to five modules to view the corresponding data.
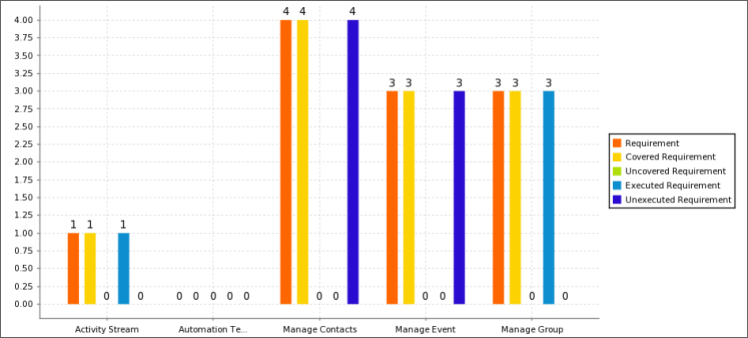
The Latest Information section displays three types of statistics.
-
Requirement: The total count of requirements which belong to the selected modules.
-
Covered Requirement: The total count and percentage of the covered requirements among the total counted requirements.
-
Executed Requirement: The total count and percentage of executed requirements among the total counted requirements.

After specifying your Report Settings, you can click the Show button to view requirement coverage data reported in the form of a columns chart. In the Legends and Chart section, in the right-most area of the chart, legends are displayed based on the previously selected modules.
The Data Grids allows you to examine the reported data up to the detail of a specific requirement. The figures displayed on the data grid reflect the most recent actual state of the requirements across the system. Click each data grid’s cell to view details of the corresponding requirements.


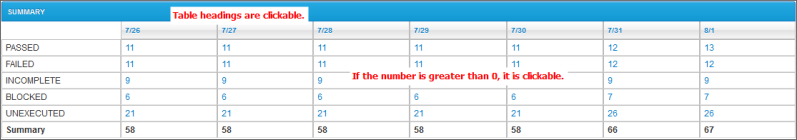
Test Execution Analysis
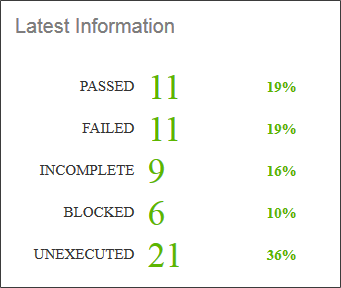
This report provides detailed statistics of Test Executions over different time ranges. It also lets users filter by various values to track the overall performance of your QAs, Test Execution progress, or the environment being tested. You can choose the data you want to view from the most recent seven days, the last 30 days, the start of your projects, or for a specific time frame.

The Latest Information area shows the current quantity and percentage of tests, grouped by the fields selected in the Report Settings area. The highlighted information provides you with a quick view of all test executions in the system.
After specifying your data filter criteria, you can click the Show button to view Test Execution data in the form of a column chart. Below the chart, legends are displayed based on the previously-selected fields and values.
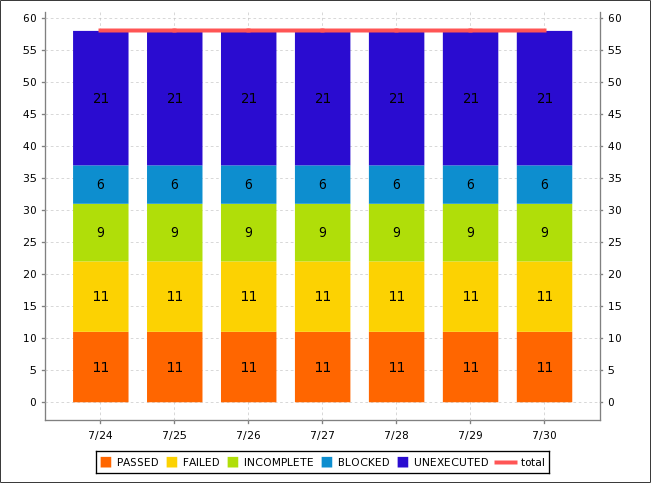
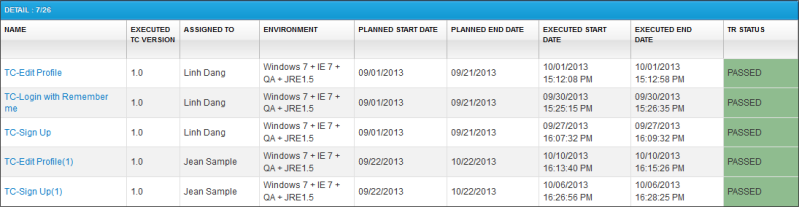
The Data Grids lets you examine the reported data up to the date level. This table is automatically refreshed to reflect the state of the column charts. For example, the data grid will display weekly statistics if the column chart displays weekly statistics. On the row that displays the dates being reported, you can click on each date cell to view details of the tests on the selected date.

Test Execution Analysis (Snapshot View)
This report shows the activities recorded in a day, week, month, or quarter or a year. You can choose the data to review from the most recent seven days, last 30 days, the start of your projects, or in a specific time frame. This report can help you determine which Test Runs have been executed and failed within each day during the last seven days.

The Latest Information area shows the current quantity and percentage of tests, grouped by the previously-selected fields. After specifying your data filter criteria, click the Show button to view your Test Execution data reported in the form of a column chart. Below the chart, legends are displayed based on the previously-selected fields and values.

The Data Grids allows you to examine the reported data up to the date level. This table is automatically refreshed to reflect the state of the column charts. The statistics provide a snapshot of the Test Execution state for a given date. You can click on each date's cell to view details of the tests for that date.

Execution Status With Defects
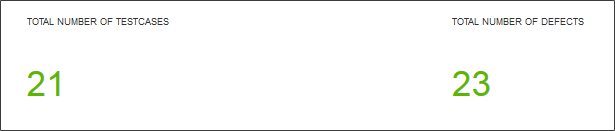
This report provides an overview of the execution status of a specific Release with the total test cases executed and their associated Defects.

The Latest Information section displays the number of Test Cases executed and the number of Defects associated with the Test Execution.
The Charts and Legends area provides a bar chart that shows the number of Defects and Test Cases in each selected module. A line indicates the average number of Defects.
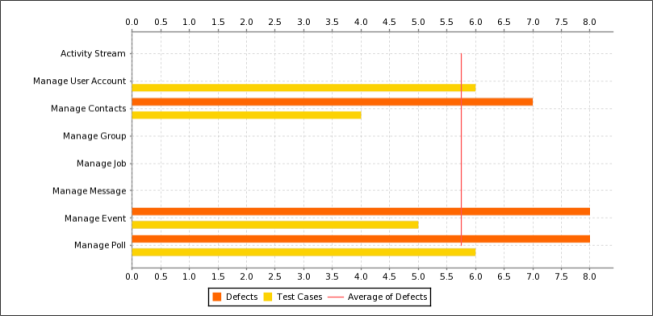
The Data Grids contains detailed data of the Test Cases executed and their associated Defects.
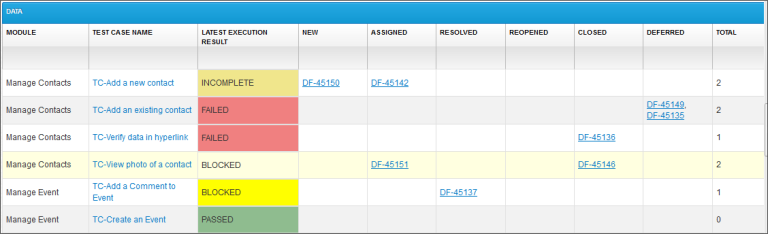
Test Execution Summary
This Report provides the Test Execution details at the report run time. The report can be filtered by Release / Test Cycle / Test Suite.

Select a Release / Test Cycle / Test Suite to filter the report. Only one field and one value can be selected at a time. You can also select one or both Test Execution types.

The Latest Information section displays the current number of Test Runs and the detailed number of Test Runs being grouped by the laTest Execution results in the selected Release / Test Cycle / Test Suite.
In the Charts and Legends area, after specifying your data filter criteria, you can click the Show button to view your defect data in the form of a Pie Chart. The chart shows the portions of Test Runs grouped by the laTest Execution results.

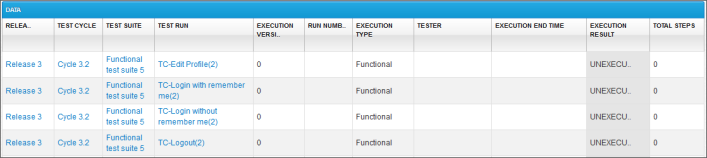
The Data Grids provides a detailed table of each Test Execution that meets your selected filter.
Test Run Summary by Assignees
This Report provides a summary of Test Runs by Assignees. The report can be filtered by Release, Test Cycle, Test Suite and Assignee.

HINT: You can select either one Filter and value or ALL. You can select one, multiple or all Assignees.
The Latest Information section displays all Test Runs within the selected criteria. Data are displayed as statistics and a pie chart.

The Data Grids contains a detailed Report of Test Run Summary, ordered by Releases, Test Cycles, Test Suites and Assignees.

The Test Run Summary by Assignees Table groups the Test Runs by Assignees and Test Run status.

Testing Velocity
This Report provides a rollup of time per Test Execution to a Test Suite / Cycle / Build / Release and the difference between the planned and actual time.

The Summary with Latest Information section shows the latest information of execution time, as follows.
-
Total Planned Time: Sum of planned execution time of all the Test Run Logs in the selected Report Settings.
-
Total Actual Time: Sum of actual execution time of all the Test Run Logs in the selected Report Settings.
-
Planned Time: Sum of planned execution time of all the latest Test Logs of Test Runs in the selected Report Settings.
-
Actual Time: Sum of actual execution time of all the latest Test Logs of Test Runs in the selected Report Settings.

The Data Grids contains a detailed report of Test Execution Time displayed in the Summary section.

Defect Analysis
This report lets you analyze Defects filtered by a variety of criteria over different time ranges, such as Status, Priority, Severity, etc. You can choose the data to view from the most recent seven days, the last 30 days, the beginning of your projects, or for a specific timeframe. The report graph lets you drill down from Year to Quarter, Quarter to Month, and to a particular date for the reported period.

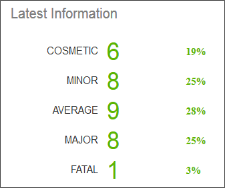
The Latest Information provides a quick view of all Defects in the system and shows the current quantity and percentage of defects, grouped by the selected fields.
After specifying your data filter criteria, select the Show icon to view Defect data in the form of a columns chart. Below the chart, legends are displayed based on the previously-selected fields and values.
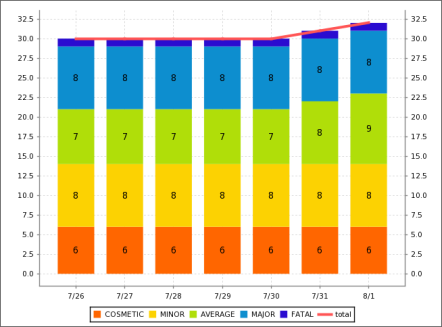
You can examine the reported data up to the date level. This table is automatically refreshed to reflect the state of the column charts. The statistics for a specific date displayed on the graph provide a snapshot of the Defects states for that date. You can click each date cell to view details of the Defects for the selected date.

Defect Analysis (Snapshot View)
This report shows the activities recorded in a day, week, month, or quarter or a year. It enables you to analyze Defects filtered by a variety of criteria over different time ranges, such as Status, Priority, Severity etc. You can choose the data to report based on the most recent seven days, last 30 days, start of your projects, or for a specific timeframe.

The Latest Information section displays the current quantity and percentage of Defects, grouped by previously-selected fields. This information provides a quick view of all Defects in the system. After specifying your data filter criteria, you can select the Show icon to view Defects data reported as a columns chart. Below the chart, legends based on the previously-selected fields and values are displayed.

Examine the reported data up to the date level in the Data Grid. This table is automatically refreshed to reflect the state of the column charts. The statistics for a specific date displayed on the graph is a snapshot of Defects at the end of that date.
On the row that displays the dates being reported, you can click on each date cell to view details of the Defects of the selected date.

Fixed Defect Verification
This report helps you verify the status of Test Runs associated with fixed and resolved Defects. The system will show the associated Test Run with the laTest Execution results for verification. Since qTest Manager allows you to use your custom status values, you must define the statuses that indicate a Defect has been fixed / resolved. 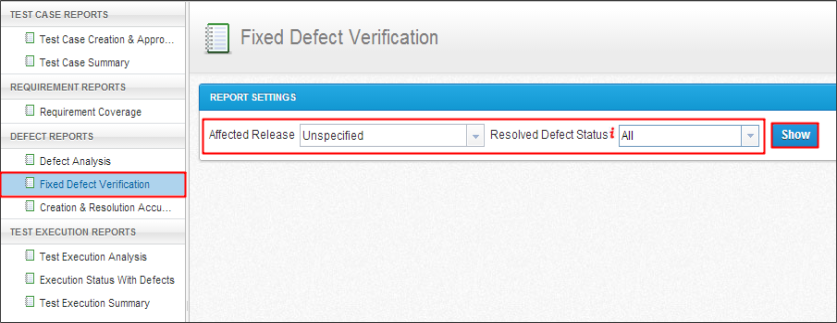
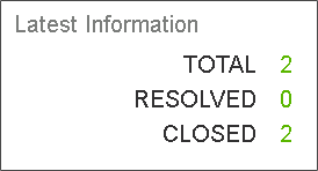
The Latest Information shows the number of fixed Defects and detailed number of Defects by each selected status in the selected Release.
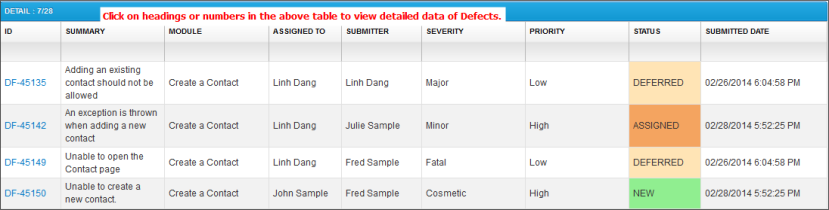
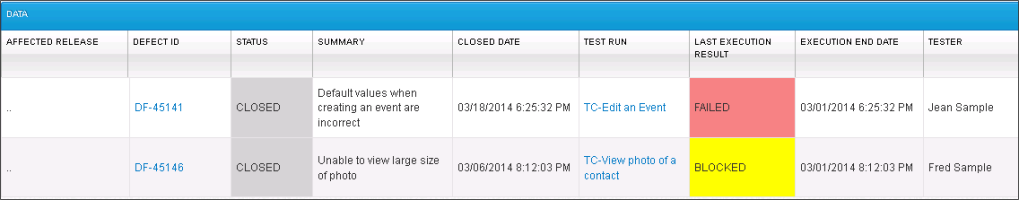
The Data Grids contains detailed data of resolved and closed Defects with the corresponding Test Run’s results.
Defect Creation & Resolution Accumulation
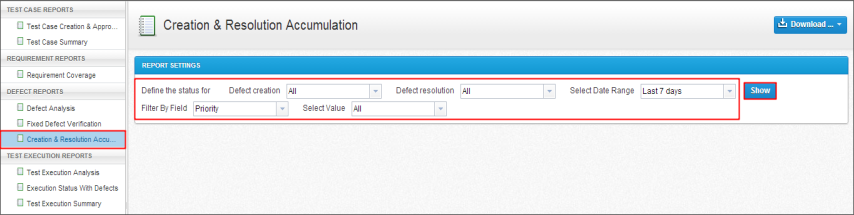
This report shows a trend of how Defects are created and resolved. You can define which statuses represent defect creation and which represent Defect resolution. The report can be filtered by various fields and values over different time ranges.
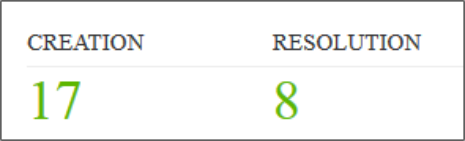
This Latest Information section provides a summary of created and resolved Defects in the selected time range.
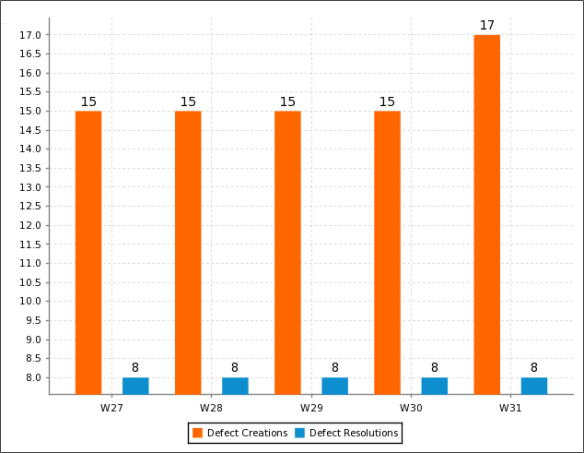
The Charts and Legends area graphically displays the number of Defects which have been created and resolved in each time unit for the selected timeframe.
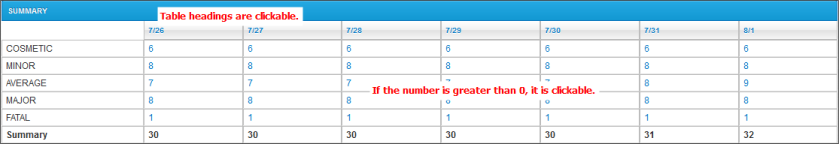
Two data grids are used to examine the reported data up to the date level. The summarized grid shows the number of Defects, grouped by their status, for each time period. These are the selected statuses which indicate the Defect Creation or Resolution. On the row that displays the periods being reported, you can click on each cell to view details of the Defects of the selected period.
Defect Summary
This report provides the Defect details at report run time. The report can be filtered by the Defect's submitted date and other properties.

Define your reporting needs with the following default criteria.
-
Defect Submitted in: Filters the timeframe in which the Defects were submitted.
-
Filter by Field and Value: Filters the report by different values such as Status, Priority, Severity, Assigned To, and Module.
-
Affected Release / Build: Release / Build the Defects were found.
-
Fixed Release / Build: Release / Build the Defects were fixed.
-
Target Release / Build: Release / Build the Defects should be fixed.

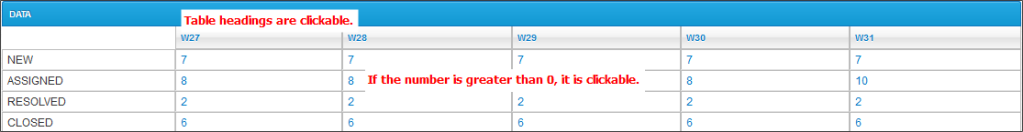
HINT: If the field's display names are changed in Field Settings, the corresponding fields should be renamed accordingly in the report filter and data table. If the fields are deactivated, they should be hidden in the report filter and the data table. The Latest Information area shows the number of new, assigned, resolved, and reopened Defects.

The Chart and Legends area displays the Defect trend, as follows.

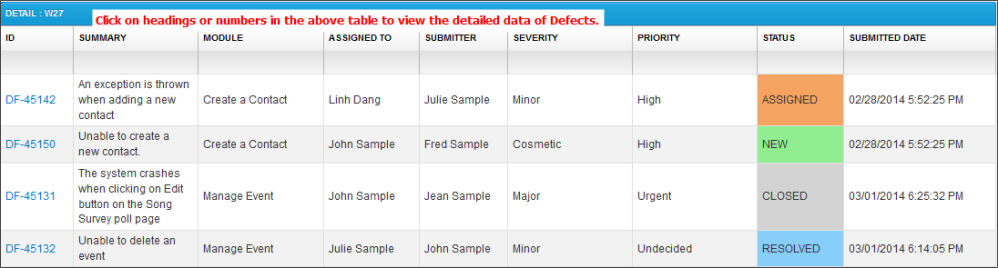
A detailed table of each Defect that meets your selected filter is displayed in the Data Grid.
