Creating and Modifying Sheets
Overview
Within Tricentis Analytics, users can both modify existing Sheets and create brand new Sheets within their Applications. Consider two possible use cases for each:
- Modify an existing Sheet: If a Base Sheet or a Community Sheet already has structure and/or data that you want to report on, you might want to only slightly modify the Sheet so to not have to re-create the entire sheet from scratch.
- Create a brand-new Sheet: if there isn’t a Base Sheet that includes the data and report structure that you are looking for and you want a fully customized and original report, you may want to create a brand-new Sheet from scratch.
In this article, we will walk you through the process of modifying and creating Sheets within your Applications.
Prerequisites
Before modifying and creating Sheets, you may want to consider reading over this article first:
Modifying and Creating Sheets Video
Modifying a Base Sheet
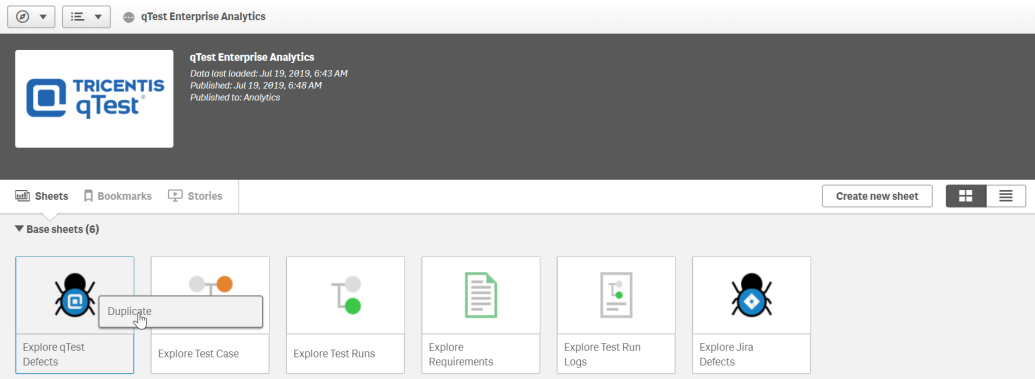
To modify a Base Sheet, you must first duplicate that sheet within your application. To do so, follow these steps:
-
Within the App Overview, right click the base sheet that you want to modify.
-
Select Duplicate.
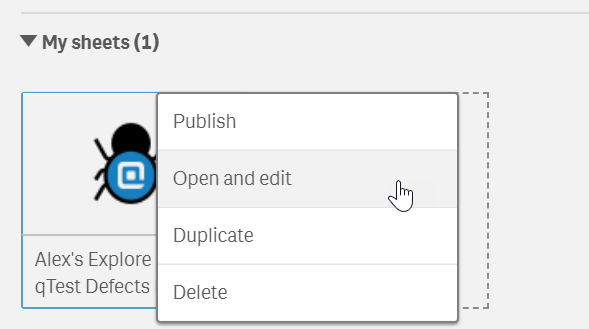
This modified Base Sheet now appears under your “My Sheets” section. You can now edit this sheet by either of the following methods:
-
Right clicking the Sheet and selecting Open and Edit
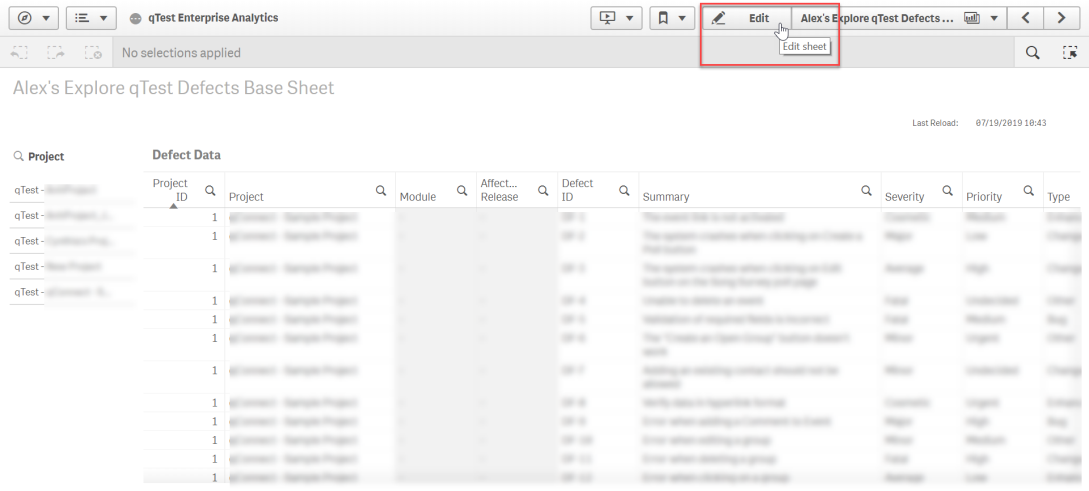
-
Opening the Sheet and selecting Edit on the top right toolbar
Or
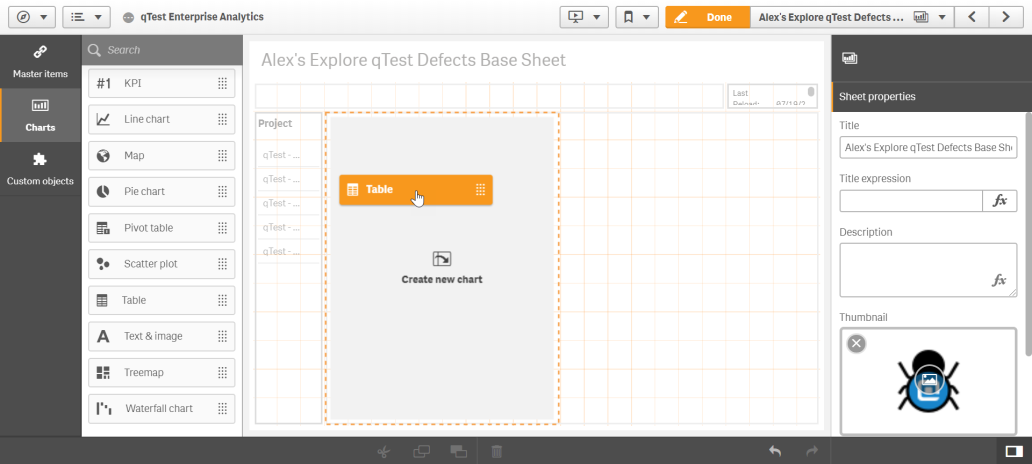
On the left-hand navigation menu, you can see Master Items, Charts, and Master Visualizations. You will use these objects, along with the settings on the left-hand side of the sheet to modify and build your sheets.
Master Items Video
For the purpose of this explanation, we are going to take an already-existing Base Sheet in your qTest Enterprise Analytics Application and modify it. I am going to modify the Explore qTest Defects Base Sheet by adding both a new table and a new pie chart.
Adding a New Table to a Base Sheet
After having duplicated and gone into edit mode, I can go ahead and start adding a table to my sheet. To do so, follow these steps:
-
Create room on your grid for the Table by resizing, removing, or deleting already-existing elements.
-
Drag and drop the Table item onto your grid in the newly created space.
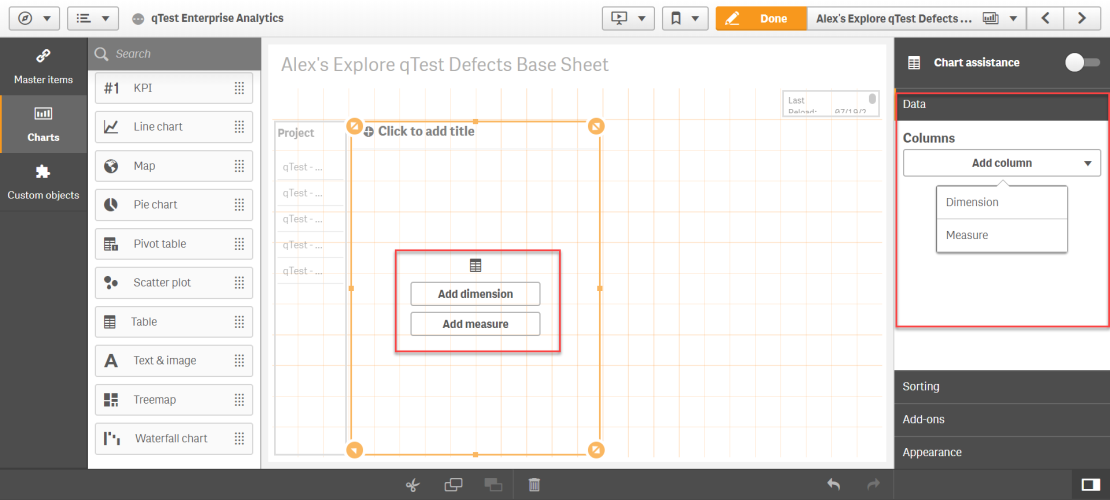
You now have a blank table item on your grid. You will see the option to add Dimensions and Measures. Details on the definition of Dimensions and Measures can be found in the Navigating the Hub and Tricentis Analytics Objects article. You will need to add Dimensions and/or Measures to your table. To add Dimensions and Measures, follow these steps:
-
Either select the Add Dimension or Add Measure icon within the blank table space or select the Add column icon in the data section of the right-hand nav menu. Then, select either Dimension or Measure.
- From the list of Dimensions, choose the one that you want to include in your table. I will choose the following:
- Defect Status
-
I also want to have a sum of Defects per each Defect Status Value. So, I add that measure into my table by selecting the Add column icon in the right-hand nav menu.
-
Choose Measure.
-
Select Defect ID.
-
Select Sum for your Aggregation type.
We now a have a working table that displays the amount of Defects per each Defect Status Value.
Add a Pie Chart
I also want to build a pie chart that will display the different amounts of Defect Priority Values within my qTest Project. To do so, I follow these steps:
-
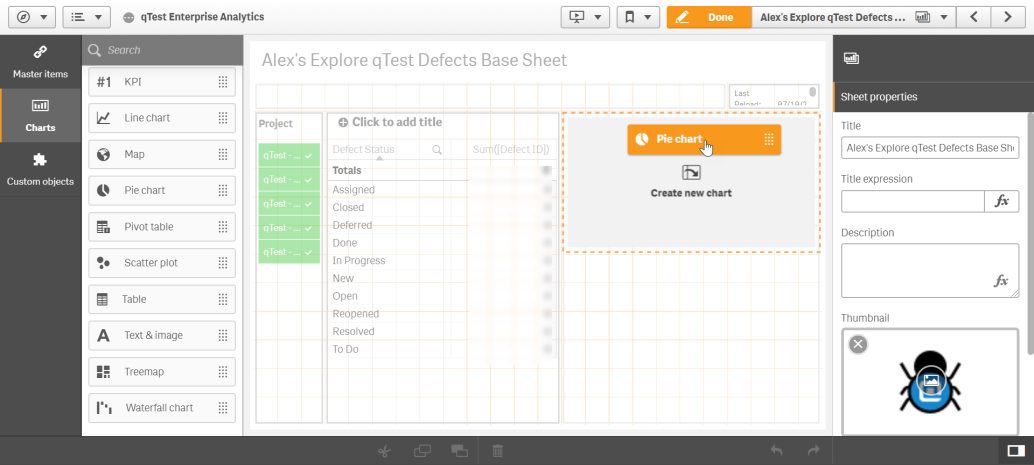
In the left-hand nav menu, select Charts.
-
Choose Pie Chart. Drag and drop it onto your grid.
- Choose the Dimensions and Measures that you want to include in your pie chart. For this example, I choose the following:
- Dimension: Defect Priority
- Measure: Defect Priority (Count)
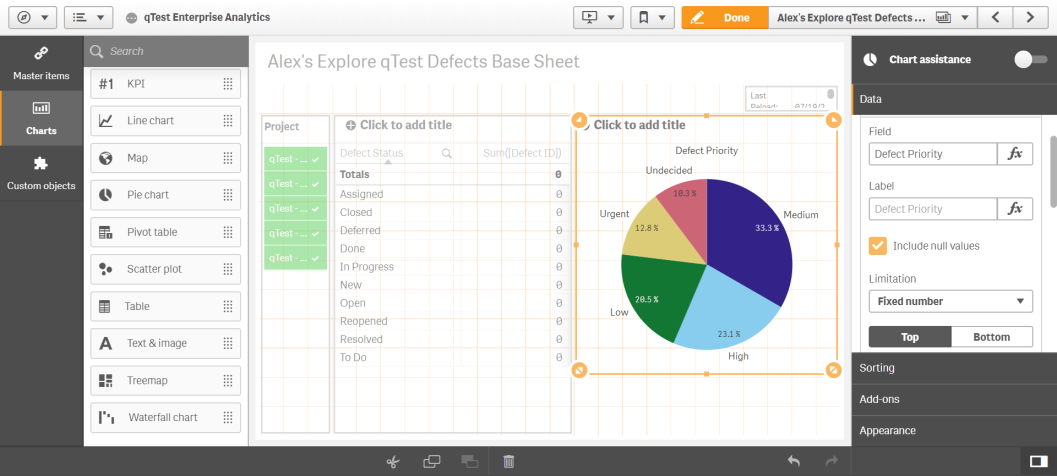
Your new Pie Chart now displays on your screen.
Modifying a Chart, Table, or Other Visualization
After your Visualizations are built, you can easily go back and edit them in a variety of ways
For our current example, I want to edit the labels in our table and change the color scheme in the pie chart. All of the modification and customization can be done from within the right-hand nav menu.
Changing the Table Labels
To change the labels in the table, follow these steps:
-
Select the table within the grid.
-
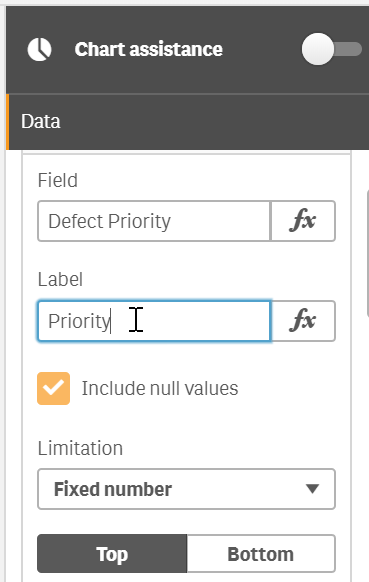
Select the Data tab within the right-hand nav menu.
-
In the Label field of each Dimension, I change the Label names from their Dimension names.
Changing Chart Colors
I also want to change the colors on our Pie Chart. To do so, I follow these steps:
-
Select the Chart within the grid.
-
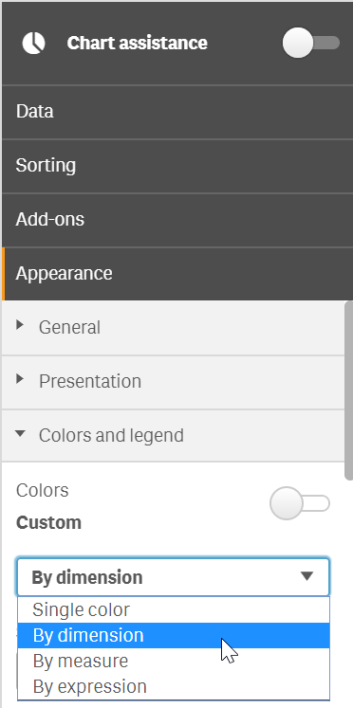
In the right-hand nav menu, select the Appearance tab.
-
I expand the Colors and legend drop-down menu.
-
By default, the color scheme is set to auto. To change the colors, deselect the auto toggle.
-
The Colors setting is now Custom. Choose from the new drop-down menu which colors strategy you want (single color, by Dimension, by Measure, or by Expression).
-
Then, scroll down to the Color Scheme section and choose the scheme that you want.
Feel free to explore the rest of the modification settings, as there are many other options and elements that you can customize.
Create a New Sheet
Creating new sheets is easy within Tricentis Analytics. Simply follow these steps:
-
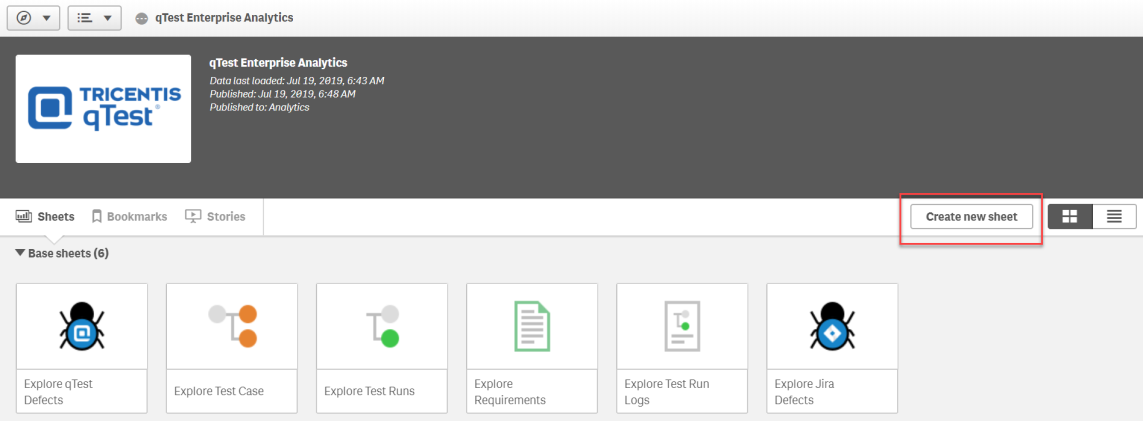
In your App overview, select the Create New Sheet icon.
-
A new Sheet will display in your "My Sheets" dashboard.
-
Name your new Sheet.
From here, you can easily begin modifying your new Sheet by following the same instructions as outlined above.
Finalized Reports
Once you are done modifying and creating your Sheets, select Done to save your Report and view it in its finalized form.