Excel Quick Start Reports
If you are using Tricentis Analytics with Microsoft Excel, a file of quick start reports is available for your use. When you initially download the Excel Quick Start Reports file, the file includes out-of-the-box reports that are preloaded with sample data, allowing you to explore the reports and determine how the data can be useful for your business. You can also add or modify reports to suit your business needs. Once you connect the file with your database, the reports load with your data.
Tricentis Analytics can also be used with different business intelligence (BI) tools. For more information about BI tool integration, refer to BI Tool Integration.
Click here to download the Excel Quick Start Reports file. For a procedure on connecting the Excel Quick Start Reports file to the Tricentis Analytics database, refer to Connect the Excel Quick Start Reports file to the Tricentis Analytics database.
The file is divided into the following sheets, each of which contain multiple reports.
|
Sheet |
Description |
Reports |
|---|---|---|
|
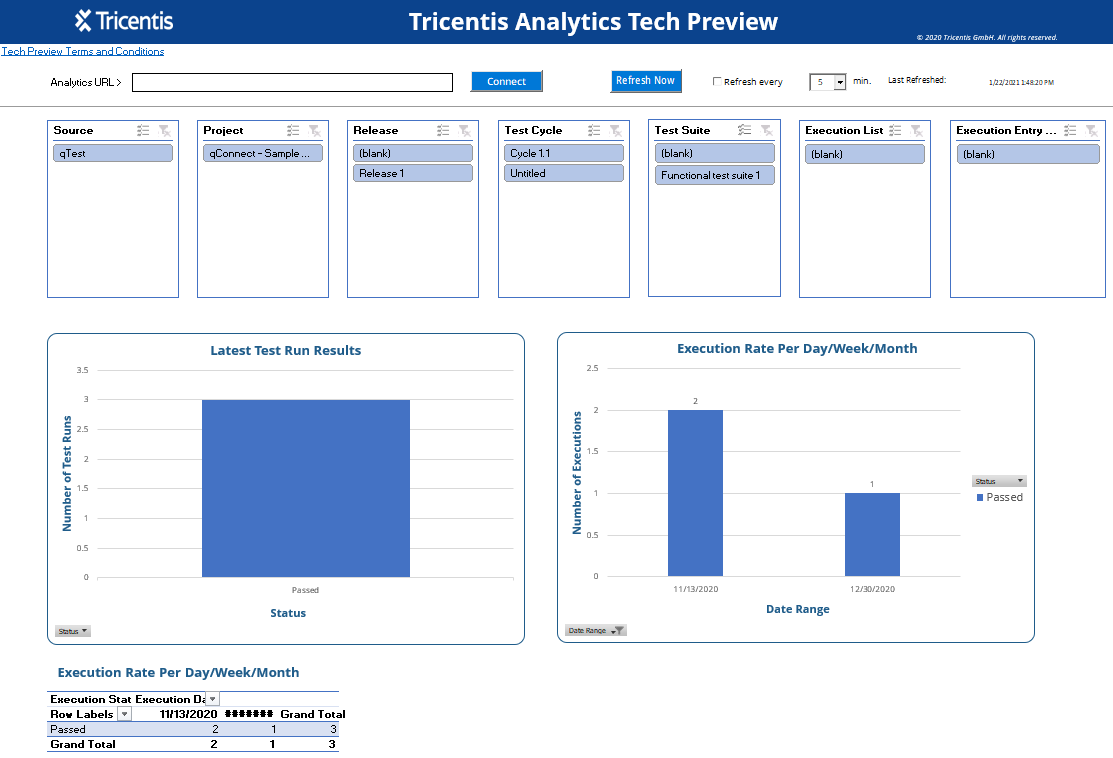
Test Summary |
The Test Summary sheet contains all execution data, organized to help you view the most recent results and execution trends. These reports can also help you compare the status of multiple executions across Projects and Releases. | |
|
Defects |
The Defects sheet contains Defect data for Jira, qTest, Tosca, and VersionOne. On this sheet, you can view reports for Defect statuses, Defect severities, and the rate of Defects opened to Defects closed. | |
|
Test Case Progress |
The Test Case Progress sheet includes reports that allow you to determine your automation rate progression and the number of Test Cases for each Project, helping you understand key repository information and analyze Project size. |
Report settings

The report settings are available on the Test Summary sheet and apply to all sheets in the file.
|
Setting |
Description |
|---|---|
| Analytics URL |
When you initially download the Excel Quick Start Report file, the file is preloaded with sample data. This field is used to connect to the Tricentis Analytics database. For the OData file, enter the data source URL that you obtained from the Tricentis Analytics API Developer Portal. |
| Connect |
Click Connect once you have entered your data source URL to connect to the database. |
| Refresh Now | Click Refresh Now to reload the reports with the most recent data from the database. |
| Refresh every | Select the Refresh every check box to indicate that the reports should automatically refresh at a certain interval. In the min. field, select the interval, in minutes, at which the data should refresh. For example, select the Refresh every check box and then select 10 in the min. field to indicate that the reports should automatically refresh every ten minutes. |
| Last Refreshed | The Last Refreshed field displays the date and time at which data was most recently updated to the reports. |
Report filters
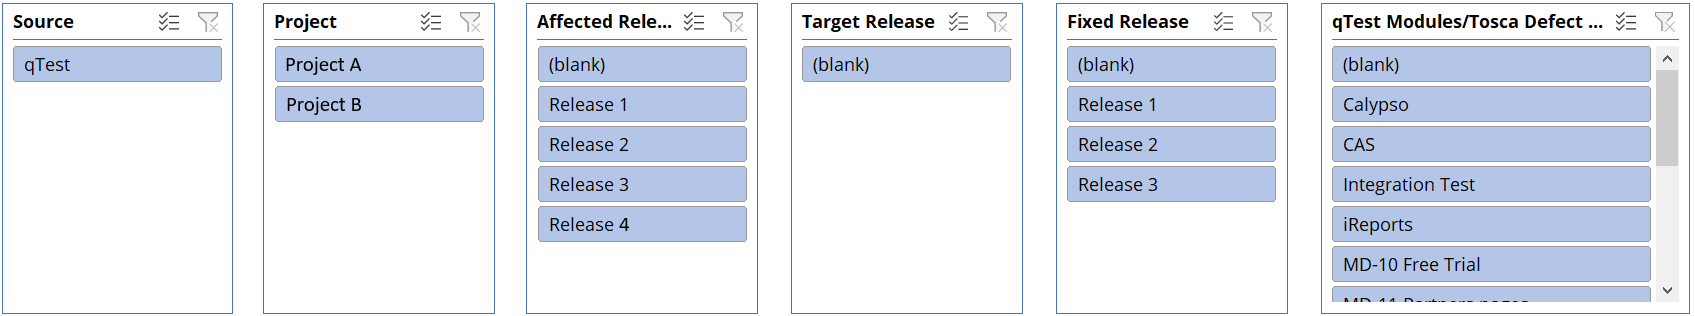
Example of report filters on the Defects tab
You can filter the data in the reports using the report filters at the top of each report section. For example, the reports on the Defects sheet can be filtered to display only information about Defects associated with a single Project. Any selected filters apply to all of the reports within each filter section. Selected values display with a blue background, and unselected values display with a white background.
Possible filter values only display if there is data for that value. For example, if Project 1 exists in qTest but nothing has been executed in that Project, Project 1 does not display as a value in the Project filter. The following data must exist for the relevant filter value to display on each tab.
-
Test execution data must exist for an associated filter value to display on the Test Summary tab.
-
Defect data must exist for an associated filter value to display on the Defect tab.
-
Test Case data must exist for an associated filter value to display on the Test Case tab.
In addition, possible filter values display based on selections in other filters. Possible values are the values that can logically be selected based on the selection made in another filter.
Filter actions
-
Select a single value. Click an item in the filter list to display only data for that item. For example, click qTest in the Source filter to display only data associated with qTest Defects on the Defects sheet.
-
Select multiple values. Click the Multi-Select icon
 to enable multiple selections. If multiple selections are not enabled, only one value can be selected in each filter.
 -
Deselect all values. Click the Filter icon
 to deselect all selected values. If a filter is selected, the Filter icon displays in color with a red X. If a filter is not selected, the Filter icon
  displays in gray with a gray X.