Datadog
Create a Datadog monitor
With NeoLoad, you can create a Datadog connector using the monitored machine creation wizard, or from an existing monitored machine. For more information, see Create and configure a monitor.
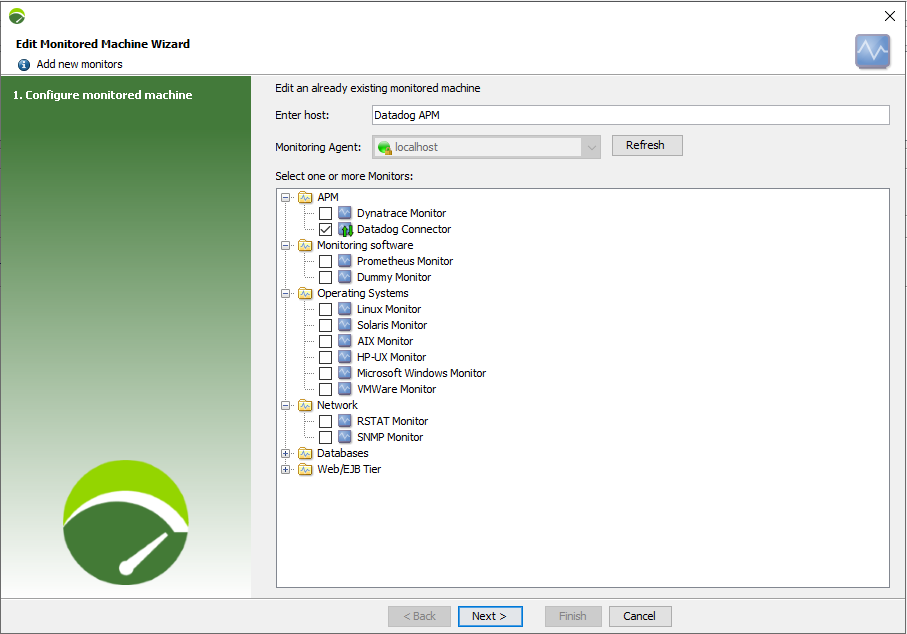
This configuration enables NeoLoad to connect to Datadog to display and graph the collected metrics.
Note: You can define a proxy to reach Datadog in NeoLoad GUI in the monitored machine. See Configure a monitored machine.
Note: You can configure the proxy under General settings > Proxy in the section Proxies list. To learn more, see Proxy.
Additional properties
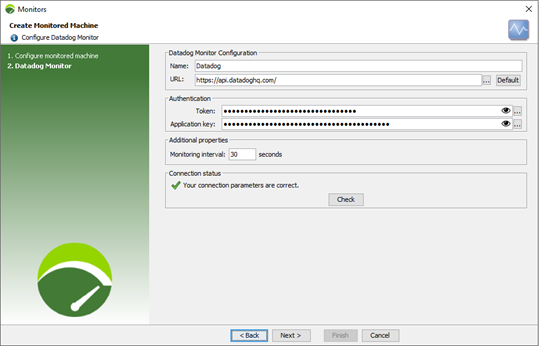
Additional properties are available for Datadog connectors. These properties determine how the counter values are calculated and sampled.
-
Name: The “friendly” name of the monitor
-
URL: The URL of Datadog API. By default, this is the URL of Datadog SaaS. Replace it with the URL of your on-premise Datadog.
-
Token: The API Key can be found on Datadog under Organization Settings > API Keys.
-
Application Key: The Application Key can be found on Datadog under Organization Settings > Application Keys.
-
Monitoring interval: The frequency at which metrics are retrieved.
Preselect queries to import
To access, select Import Counters.
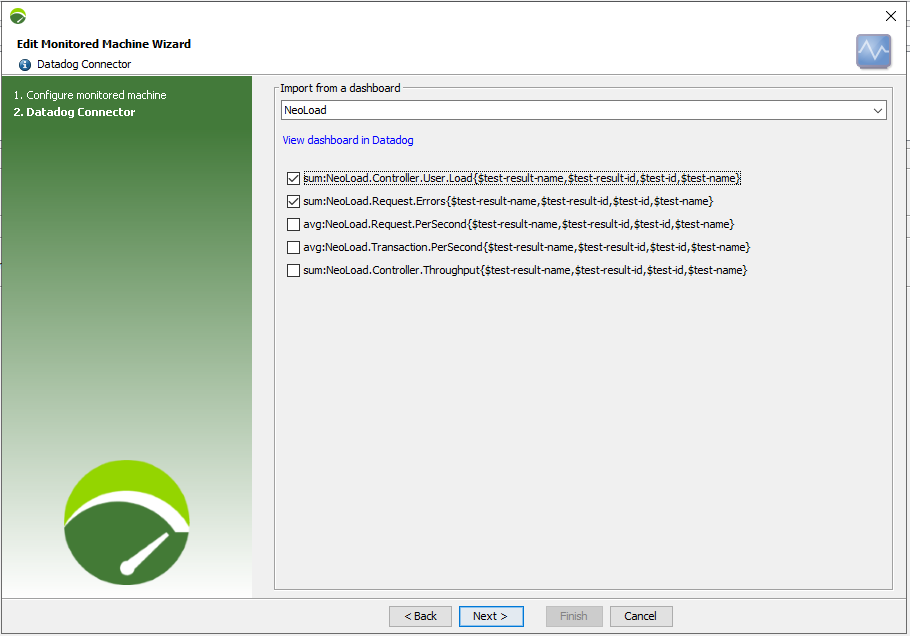
This step allows you to preselect which queries to import from the Datadog dashboard. Simply:
-
Click the Import from a dashboard drop down and select a dashboard to import from.
-
Select which queries to import.
Note: To view the queries in Datadog, click View dashboard in Datadog
-
Click Next.
The queries selected to import are preconfigured.
Queries
To access, select Configure counters.
This step enables you to configure queries on the Datadog server. You can test them by displaying the matching graph for the last hour.
Add as many queries as you want using the  button and delete a query with the
  button.
The Query field must contain the Datadog query. You can type your query using Datadog language, for more information refer to Querying in the Datadog website. Or you can copy and paste the query in NeoLoad as-is from the Datadog UI. Simply:
-
Design and test the query directly in Datadog to utilize the auto-completion of the Datadog query editor.
-
Display the query in text format in Datadog then copy and paste it into NeoLoad.
In the Legend format field, enter the name you want to give to the curve and the name of the corresponding counter.
The Group by field enables you to decide how the tree is displayed in the results.
Note: In each of these fields, you can click on the ellipsis button  to pick a NeoLoad variable.
The configuration of the counters of the Datadog connector allows you to define a query from an as-code file containing variables.
Use the tags stated just above the simulation graph between double curly brackets to replace the tags by their values in the names of the curves of the graph (Legend format field)
The graph and its legend display the results of the query typed in the Query field.
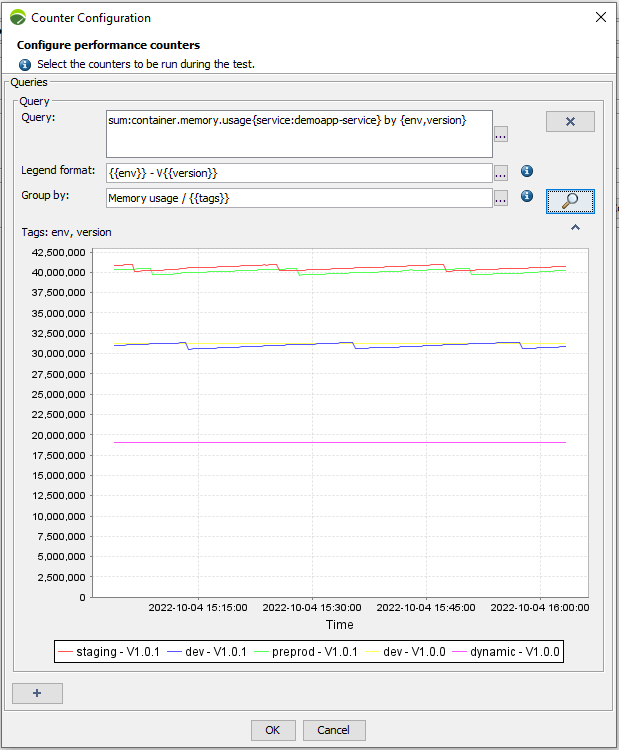
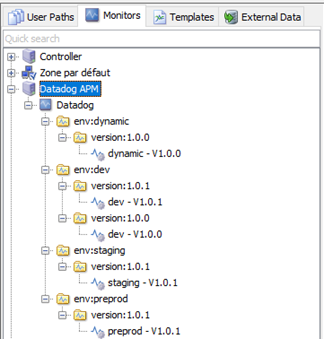
Example: The above query shows the memory usage for all docker containers that are part of the service "demoapp-service". The results are grouped by Environment/Version. The value is in octets. Divide by 1024 to convert the value into Mo. The blue curve shows that the containers with env "dev" and version "1.0.1" used 54 Mo of memory in the past hour.
Configure Push Counters
To access, select Configure push counters.
This step allows you to send events to Datadog when a test starts/ends, add additional HTTP headers, and correlate Datadog data with NeoLoad.
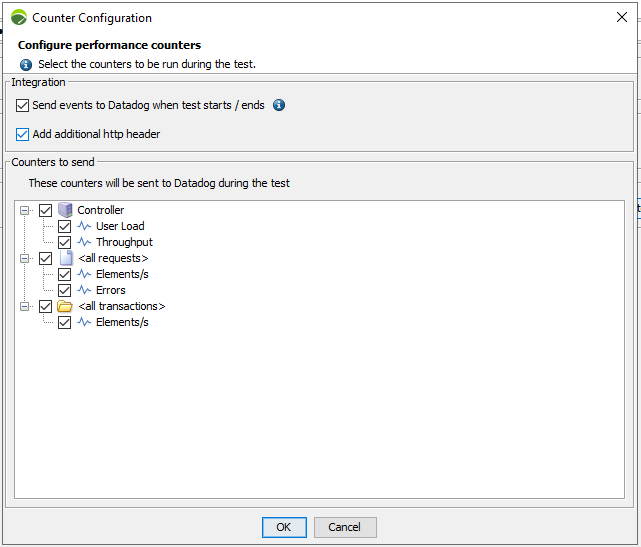
By default everything is enabled when you create a monitor. The chosen metrics are sent to Datadog while the test runs.
-
Send events to Datadog when test starts/ends: When enabled, two events are sent to Datadog: one at the start of the test and another at the end. You can filter events in Datadog using the tags: Test ID, Test Name, Test Result ID, and Result Name.
Note: You can access the test results overview and test analysis from the event in NeoLoad Web.
-
Add additional http header: When enabled, a new HTTP header is created in Project settings > Runtime parameters > Requests.
Note: You can add a specific header in the traffic generated by NeoLoad. Datadog currently implements a traffic filtering feature. When available, it is possible to isolate the traffic coming from NeoLoad tests.
-
Counters to send: This allows you to push NeoLoad metrics to Datadog. When enabled, you can correlate Datadog data with NeoLoad data.
Note: The period of time between two metric values is 5 seconds. It can be set from the following property in milliseconds (minimum value 1000ms): In the installation directory of NeoLoad. In <install-dir>/conf/controller.properties[Runtime]stats.sample.time=5000
In Datadog, you can filter events by the tags test id, test name, test result id, and test result name.
The output
The Datadog APM query results are in the tree Results > Graphs > Monitors section of NeoLoad.
Dynamic counters
If new counters are identified by Datadog during the test, they are displayed in the Results graphs of NeoLoad GUI and NeoLoad Web.