View and Filter Host Machines and Jobs
The qTest Launch homepage displays high-level information about all registered automation host machines (hosts) and the jobs associated with the hosts. You can display the homepage in Hosts view or in Jobs view.
Filter hosts and jobs

You can filter and search for host machines and jobs by entering search criteria in any fields on the filter panel.
Once you have entered your criteria, click Filter to apply the criteria and refresh the grid to display matching results. Any criteria entered displays as a token beneath the filter panel. To clear a specific criteria, click the Delete icon ![]() for the token.
for the token.
| Field | Description |
|---|---|
| Project | Select Projects to search for hosts that have an Agent or job associated with the selected Projects. |
| Host Name | Type a host name to search for hosts with names containing the entered text. For example, entering Post would return hosts with names such as "AT API Postman Host-100" or "Post Results Test Host". |
| Status | Select whether to search for hosts that are online or offline. If no status is selected, both online and offline hosts will display. |
| Tag | Type a tag to search for hosts with tag containing the entered text. For example, entering 1 would return hosts with tags such as "Host 1" or "Version 1.6.3 Host". |
| View By | Click Hosts to filter and display hosts in Hosts view. Click Jobs to filter and display jobs in Jobs view. |
| Schedule Tests | Click Schedule Tests to access the Schedule Test Run: Select Cases dialog, where you can schedule Test Execution jobs for Test Runs, Requirements, and Test Cases. |
| Settings |
Click the Settings icon |
Hosts and Jobs summaries
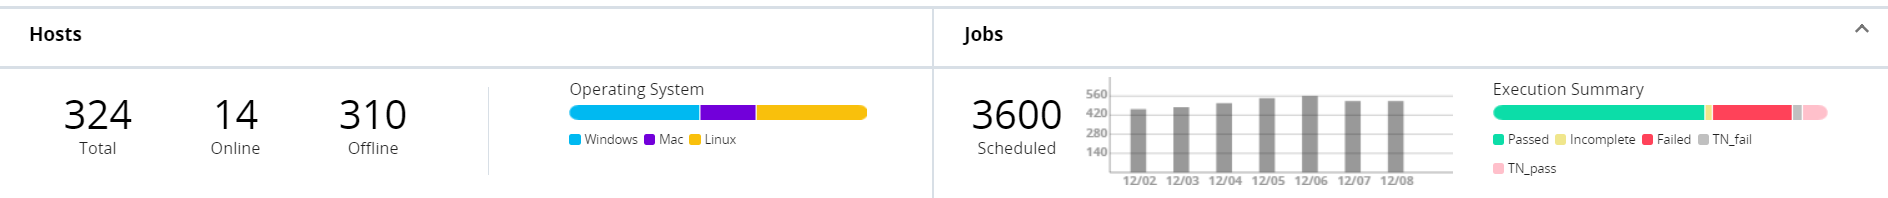
The Hosts and Jobs summaries display overview information about the hosts and jobs in qTest Launch. The data included in the summaries reflect the items currently displayed in the results grid. If no criteria is entered in the filter panel, the summaries display information for all hosts and jobs.
| Hosts summary | Jobs summary |
|---|---|
|
The Hosts summary displays the following information.
|
The Jobs summary displays the following information.
|
Hosts view
Click Hosts in the View By field on the filter panel to filter and display hosts in Hosts view. Hosts view displays all hosts that match the current filter criteria. If no criteria is entered in the filter panel, all hosts are listed in the Hosts grid.
Using the pagination tools at the top of the grid, you can select a page number to view results on the selected page, access the next page or the previous page of results, and select the number of rows that should display per page.
Click Upgrade to upgrade hosts or Edit to edit hosts, as needed.
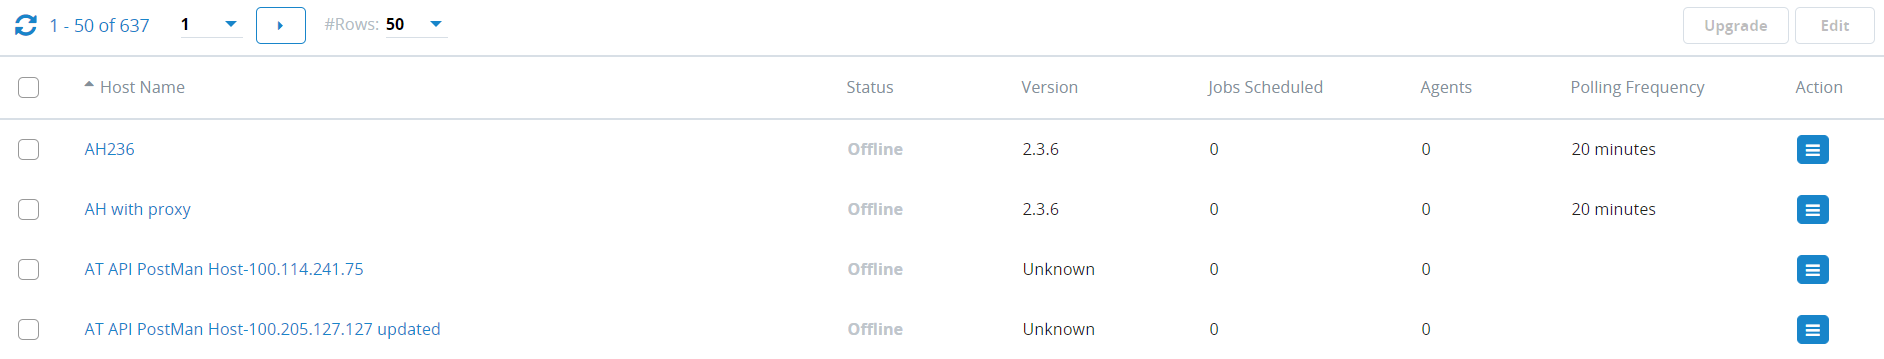
The following columns display in the Hosts grid. You can click a column heading to sort the results in ascending or descending order.
| Column | Description |
|---|---|
| Check box | Select a host. You can select multiple hosts at a time or select all hosts on a page by selecting the check box in the column heading. |
| Host Name | The name of the host. Click the host name link to access the Host Details dialog, where you can view additional details about the host. |
| Status | Indicates whether the host is online or offline. |
| Version | The version number of the installed software. Version numbers only display for hosts that are version 2.0 or later. |
| Jobs Scheduled | The number of jobs scheduled on the host for the current week. Jobs that have already been executed are not included in the total. |
| Agents | The number of automation Agents configured on the host. |
| Polling Frequency | The configured polling frequency for the host. The polling frequency is the frequency at which the host polls qTest Launch or qTest Manager to check for updates to configurations or to determine whether new jobs have been scheduled. |
| Action |
Click the Action icon
|
Jobs view
Click Jobs in the View By field on the filter panel to filter and display jobs in Jobs view. Jobs view displays all jobs that match the current filter criteria. If no criteria is entered in the filter panel, all jobs are listed in the Jobs grid.
Using the pagination tools at the top of the grid, you can select a page number to view results on the selected page, access the next page or the previous page of results, and select the number of rows that should display per page. Additional filters are also available, allowing you to filter jobs by schedule status and last run status. Select the Show Tosca Jobs check box to refresh the Jobs grid and display only jobs that contain Tosca tests.
To delete a job, select the check box for the job, and then click Delete.
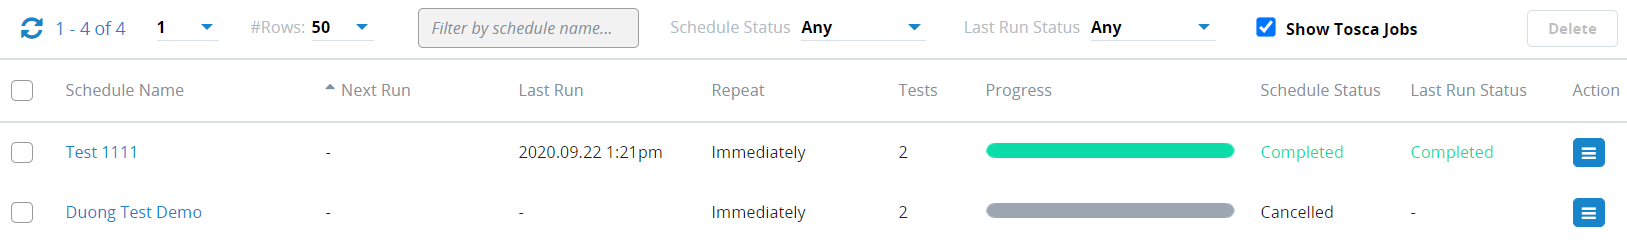
The following columns display in the Jobs grid. You can click a column heading to sort the results in ascending or descending order.
| Column | Description |
|---|---|
| Check box | Select a job. You can select multiple jobs at a time or select all jobs on a page by selecting the check box in the column heading. |
| Schedule Name |
The name of the scheduled job. Click the schedule name link to access the Job Details dialog, where you can view additional details about the job. The schedule name appears in red text when a Test Run associated with the schedule was deleted in qTest Manager. In this event, the scheduled job will not be executed by the host and will not be submitted to the deleted Test Run. The schedule is displayed for user awareness only.
|
| Next Run | The date and time that the job is scheduled to run next. |
| Last Run | The date and time that the job last run on. |
| Repeat | The frequency at which the job is scheduled to run, such as daily. |
| Host - Agent | The name of the host and Agent that will execute the job. |
| Tests | The number of Requirements, Test Cases, or Test Runs that are scheduled to be executed. |
| Progress |
A progress bar that displays the progress of a Tosca job. Hover your cursor over the progress bar to display a color legend that indicates the estimated percentage of completion. This column only displays if the Show Tosca Job check box is selected. In addition, the progress of a job currently does not automatically update in real time. To display the most recent progress estimate for a job, click the Refresh icon
|
| Schedule Status |
The status of the schedule. The following statuses are available.
|
| Last Run Status | The most recent run status of the job. |
| Action |
Click the Action icon
|
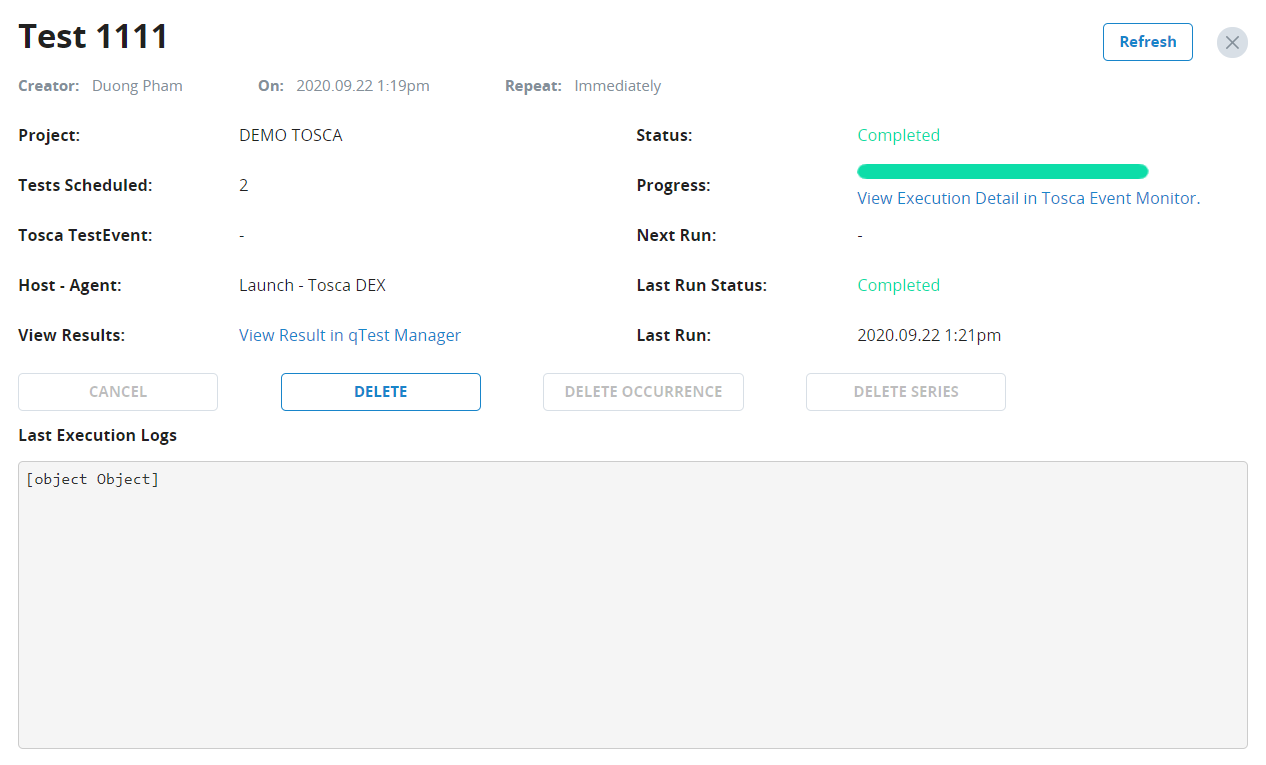
View additional job details
You can view additional details about a scheduled job on the Job Details dialog. To access the Job Details dialog, click the schedule name link in the Schedule Name column on the Jobs grid. You can also click the Action icon ![]() in the Action column, and then select View Schedule Details. The Job Details dialog displays details such as the host and Agent used to run the schedule, the next date and time that the schedule will run, and the most recent execution logs.
in the Action column, and then select View Schedule Details. The Job Details dialog displays details such as the host and Agent used to run the schedule, the next date and time that the schedule will run, and the most recent execution logs.
Click the link in the Results Folder field to navigate to the test results associated with the schedule in qTest Manager. Click the link in the Progress field to access Tosca Event Monitor, where you can monitor test executions for scheduled Tosca tests.